2 Ways to Determine Trend Strength
One part of the puzzle we call profitable trading is knowing which direction price action is probable to go next. Stating the obvious? Well, yes and no. The term “trend” is a highly relevant thing that pertains to timeline of a trade’s expected hold time = distance. Do we intend to exit quickly for small gains? Hold through market noise for bigger gains? Overnight or beyond several sessions for trend trade gains? An uptrend for one relative timeframe can be a downtrend for smaller or larger timeframes.
Click here to order your copy of The VXX Trend Following Strategy today and be one of the very first traders to utilize these unique strategies. This guidebook will make you a better, more powerful trader.
Some measures of “trend” or directional bias are absolute. In other words, it doesn’t matter what size chart one views as the data remains static. Two of those type chart tools are dynamic pivots and volume-weighted average price.
Dynamic Pivots are a chart tool we’ve discussed here before. They are price levels that adjust with the flow of price action. This price study measures the current period’s price range from low to high, with price values plotted of 25%, 50% and 75% levels. These values are based on the high and low measure of any given period on a chart. For intraday or short-term trading, using the cash session (pit) only chart or all-session (24 hour) chart will give different grid levels in e-minis most days.
The same is true for any market that trades electronic and pit session periods. It’s not a question of which time period settings “work best” for price measurement tools like this… they are designed to be used within the timeframe you already trade. Whether your charts are set for cash-session only in or the entire 24-hour period reference is likewise the same preference for dynamic pivot settings. They compliment your existing approach, whatever it may be.
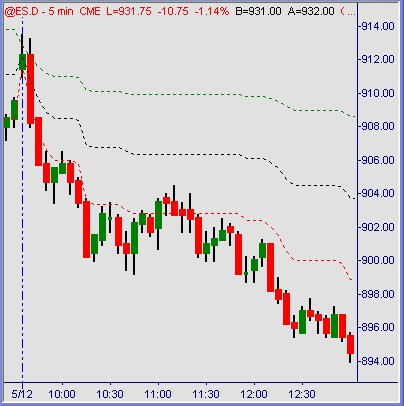
Chart 1:

For example, this five minute chart of the S&P 500 emini futures (ES) shows price action moving through the pivotal grid levels 75% > 50% > 25% of measure-period range levels. Price action below the 25% level is usually sustained during bearish trend moves, which the session (example above) of 5/12 was. Note how each pullback to the 25% “dynam” level zone marked a pause = continuation lower. While there is no defined edge for specific trade entry signals at the levels, using them as measuring tools for trend probability is invaluable.
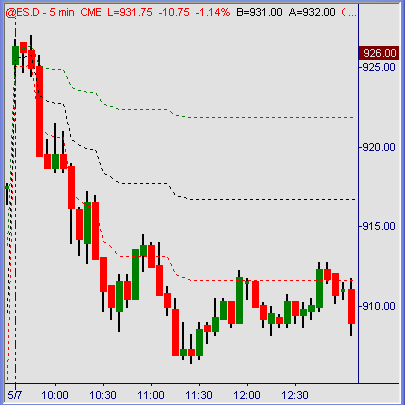
Chart 2:

There are many ways to use this tool as part of your trading approach. Directional bias filters would be one of those. Price action moving up or down through the scale demonstrates continued direction or possible trend reversal depending on where it stops and starts. A basic rule of thumb is this: aggressive long mode or even long-only and no shorts above the 75% level with the opposite aggressive short mode or even short-only and no longs below the 25% level.
That rule alone will keep traders seeking longs in a rising market and shorts in a falling market. When price is near/at/above its own upper 25 percentile of low to high overall range, momentum strength is obvious. The opposite is equally true when price levels are at/below the 75 percentile of high to low span, momentum weakness is glaring. A body in motion tends to stay in motion.
Disregarding sideways choppy-slop sessions, any real directional push in price tends to last longer than most traders believe it can or will. Just ask anyone who has shortened their career by the too-common mistake of persisting to sell a grinding rally or buy a waterfall decline. The market itself doles out our highest-price lessons on trading.
Learning from trial & error means paying through the nose for errors. Fighting a trend, be that minutes or hours in duration has drained more trading account dry than any other single factor out there. Respecting price strength or weakness when clearly visible on its own percentile of range grid is one excellent way to flow with your market instead of fighting it.
Various chart services may offer this tool as a standard default, or have it easily written from the equation of current high-low and 25%, 50%, 75% of the range. Any chart service offering retracement grids can manually snap the low and high points of a period while measuring out the desired levels, adjusting to new highs or lows as the day wears on. Simple as that.
Volume-Weighted Average Price or “VWAP” indicator is a secondary type chart tool useful for eyeballing relative strength or weakness in a market. This study measures volume flow relative to whatever period of time the trader opts to measure. I plot the daily vwap measure to see where averaged volume flow has taken place.
As with any indicator or chart tool, lots of different ways to view & use the information is possible. All kinds of fading or mean-reversion tactics can be applied to this study. But for me it’s pretty simple: if price is above that average volume flow, momentum strength to the upside is present. Opposite is equally true for the downside… price action below the current vwap for a given day means downside pressure exists at that moment in time.
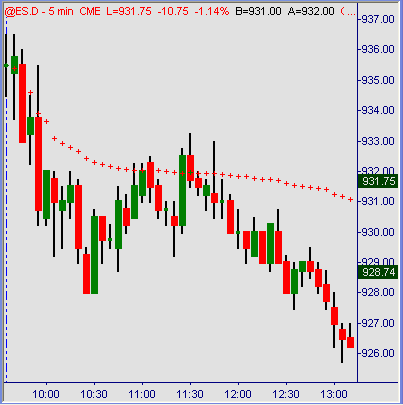
Chart 3:

Above snapshot of a recent day shows where price held below its vwap measure for nearly the entire session. A couple of tests into that zone of resistance met further selling pressure through the afternoon stretch. Taking sell signals that confirm at or below that rolling intraday level is one more zone of relative weakness in tapes you intend to sell.
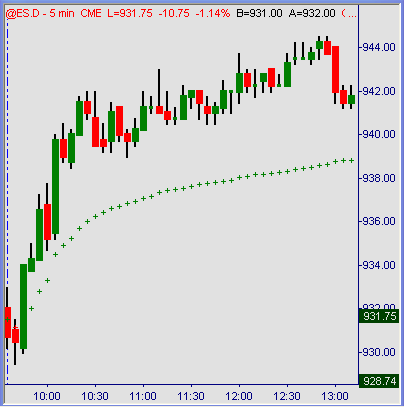
Chart 4:

As always, the opposite is true for rising markets. Price action kept its pace well above average intraday volume the entire session in this example. Buying dips when long signals confirmed was trading with visible strength. Trying to sell potential failures there was essentially a fight with an upwards drifting trend.
Summation
There is a lot more to successful trading than knowing whether price is probable to go up or down. But that’s a pretty important place to start. It is true that financial markets spend plenty of time going sideways. It is equally true that those sideways periods offer anyone and everyone the least potential for profit, period. Directional market action, up or down offers everyone the most potential for profit. Using price action studies that measure a market relative to itself for directional momentum and manage your trading decisions accordingly is a critical step for long-term success.
Austin Passamonte is a full-time professional trader who specializes in E-mini stock index futures and commodity markets. Mr. Passamonte’s trading approach uses proprietary chart patterns found on an intraday basis. Austin trades privately in the Finger Lakes region of New York. Click here to visit CoiledMarkets
Just released! Leveraged ETF PowerRatings ranks Leveraged ETFs on a high probability 1-10 ratings scale. Click here to get your free trial now.
