A Truly Outstanding Indicator: RSI
The technical trader of today has an incredible variety of indicators to assist in forecasting a stocks next move. This was not always the case. I started trading several months before the personal computer came into vogue. Technical analysis consisted of looking at long term paper charts generally published in book form thus being forced to utilize whatever indicators the publishers would print.
Any real time charting would need to be done by hand on graph paper with a data feed coming from the precursor of CNBC, FNN or, if you were fortunate, a FM radio transmitter from a company called Data Broadcasting Corporation or DBC. They were the ancestor of the now popular eSignal data service. We were limited to just a handful of indicators such as the moving average and volume. Things have changed dramatically with the advent of the PC. Now it’s a matter of weeding out the countless indicators of dubious value to focus on ones proven to have value.
One of the most popular indicators today is the Relative Strength Index or RSI. It is an oscillating momentum indicator created by Welles Wilder and first popularized in his 1978 Technical Analysis tome “New Concepts in Technical Trading Systems”. It’s generally used by traders in line chart form to determine if a trading vehicle is overbought or oversold.
It compares increasing price movement to decreasing price movement over a specific time frame. This figure is displayed as a line on a chart, oscillating between 0 and 100. 30 and below is considered “oversold”, 70 and above is considered “overbought”. The theory is, in other words, when the line goes above 70 it means to look to sell as all the buyers are thought to be already in. Below 30 means that everyone has already sold, and its time to buy as all the selling is complete.
Mathematically, RSI is the ratio between the upward and downward price moves normalized into a value that falls between 0 and 100. For those of you so inclined, the equation for RSI is 100-100/(1 + (total gains/n)/(total losses/n). N is the total number of RSI periods. Wells Wilder taught that 14 is the standard number of periods to use. Most programmed RSI TA indicators use 14 as the default number of periods.
We decided to test the true effectiveness of the RSI over a huge sample size of trades. What we found was quite surprising. There is absolutely no value in using the RSI as it was originally built with 14 periods. We then tweaked the indicator using different period lengths to determine if there was potential value at the different periods prior to discarding the effectiveness of the RSI as simply an old wives tale. What we found was amazing, when the period length was reduced to 2, the RSI clearly placed the odds of a short term move in the traders favor. In fact, if the RSI(2) was less than 2, the odds of a short term up move increased in a statistically significant manner. If the RSI(2) came in above 98, the odds of a short term down move also swung to a positive reading.
The RSI(2) is truly an outstanding indicator. In fact, it is the best indicator of a stocks short term directional moves that we have ever tested.
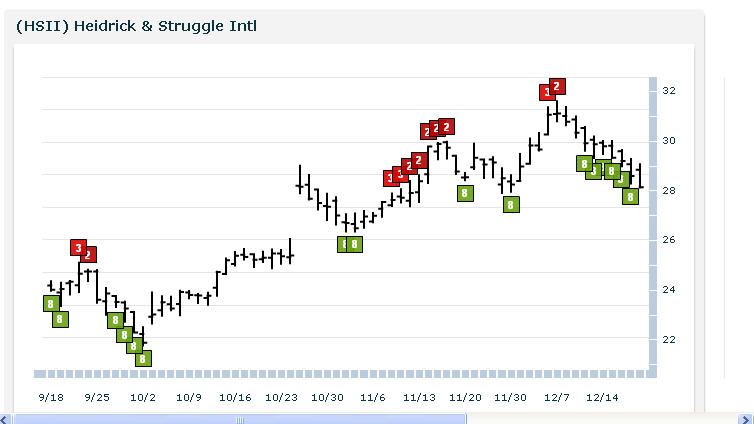
Here are 3 stocks with an RSI(2) less than 2 setting up for a short term bullish advance:
^HSII^

^ELOS^
^BVN^
Learn more strategies for trading stocks in the short term with a free trial to our PowerRatings! The highest rated stocks have outperformed the average stock by a margin of more than 14.7 to 1 after five days! Click here to launch your free PowerRatings trial today!
David Goodboy is Vice President of Business Development for a New York City based multi-strategy fund.
