Big Oil Spill is Big Bonus to Day Traders
From 1990 to 1997, Kevin Haggerty served as Senior Vice President for Equity Trading at Fidelity Capital Markets, Boston, a division of Fidelity Investments. He was responsible for all U.S. institutional Listed, OTC and Option trading in addition to all major Exchange Floor Executions. For a free trial to Kevin’s Daily Trading Report, please click here.
The SPX finished the week at -2.5% to 1186 .69, and was +1.5% on the month. It was a rocky week with the Euro sovereign debt crisis, Oil spill and GS inquisition by an inept Congress.
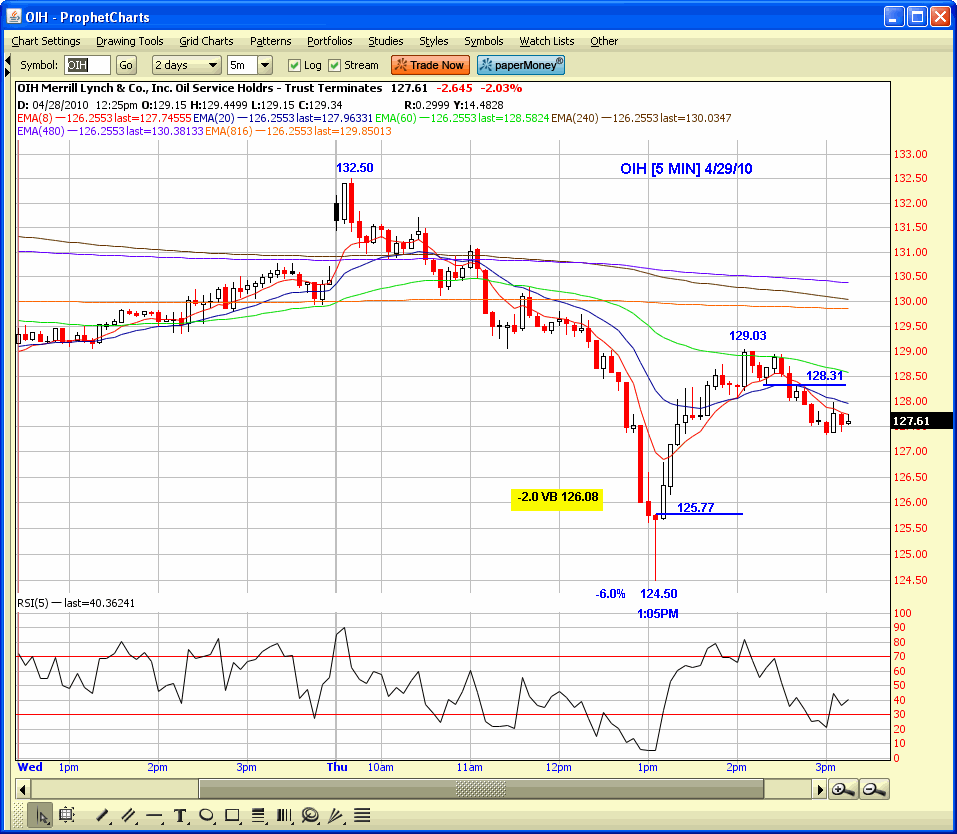
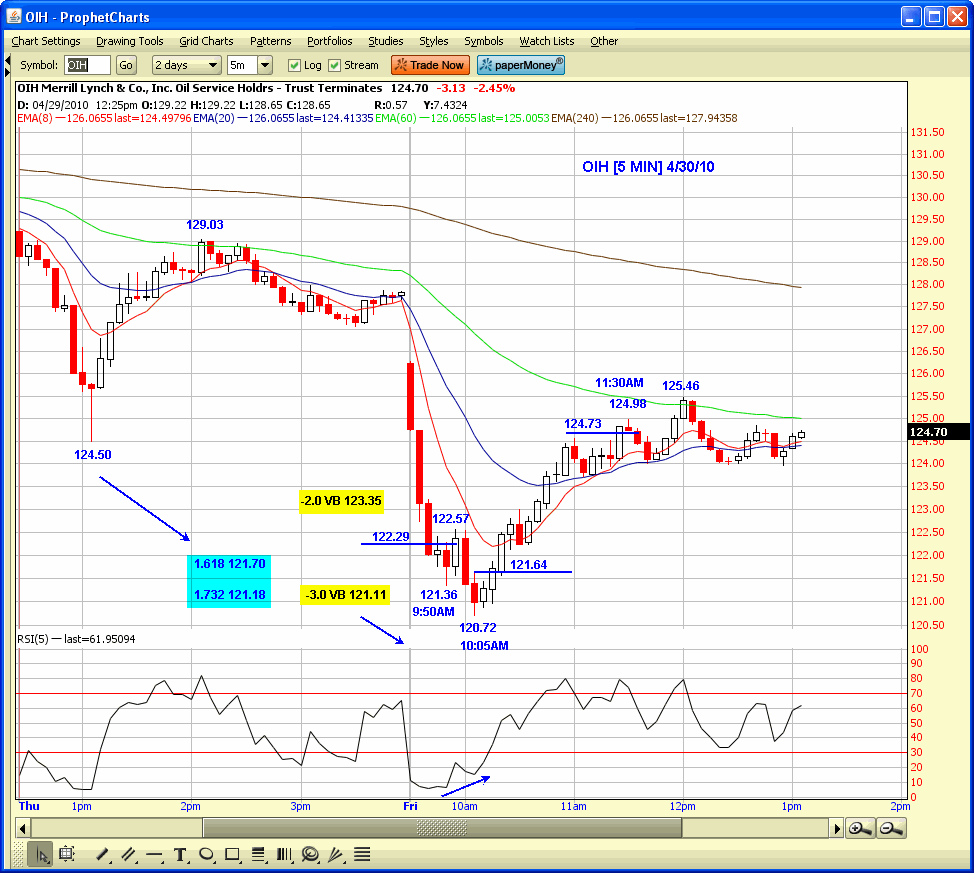
The OIH led the downside last week at -8.8% as the oil spill accelerated, but it was a bonus for trading service members that traded the extended volatility band setups. I have included the OIH charts for 4/29/10 and 4/30/10, which outlines the symmetry and highlights of the trading action.
The initial trade on 4/29/10 followed the -6.0% decline to the 124.5 low, and below the -2.0 Volatility Band. It was a one entry trade above the signal bar 125.77 high, and exited on a 5 bar reversal below 128.31. The trade on 4/30/10 took two entries from the -3.0 VB zone. The entry above 122.29 after the 121.36 low was stopped out for a small loss after the reversal from 122.57, but the second entry above the 121.64 inside bar pattern high was exited below 124.73
You can learn about the high probability of extended volatility band setups by taking a 1 week free trial to the trading service.
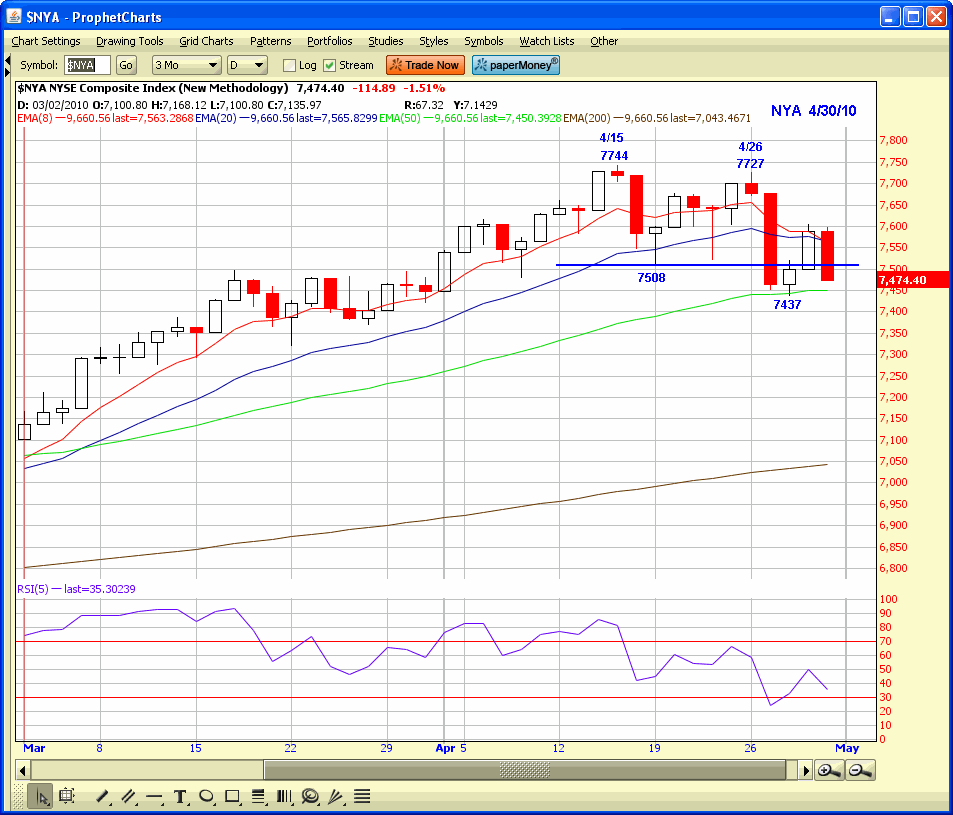
The NYA, which is the broadest major index, made a new rally high right on the significant 4/15 time date, but then made a lower high on 4/26, while the SPX, INDU, IWM, MDY, and COMPX all made new marginal highs. That negative price divergence by the NYA, in addition to negative momentum divergences by all the other major indexes as they made new rally highs, is obviously a strong red alert for a May correction, with the SPX trading down to at least the 1152.84 .382RT to the 2/5/10 1044.50 low, and major support at the 1150.45 1/19/10 high. That would only be a -5.7% decline from the 1219.80 high, so expect that to be the minimal decline.
Have a good trading day!


Click here to find full details on Kevin’s courses including Trading with the Generals with over 20 hours of professional market strategies. And for a free trial to Kevin’s daily trading service, click here.
