Capre’s Forex Report
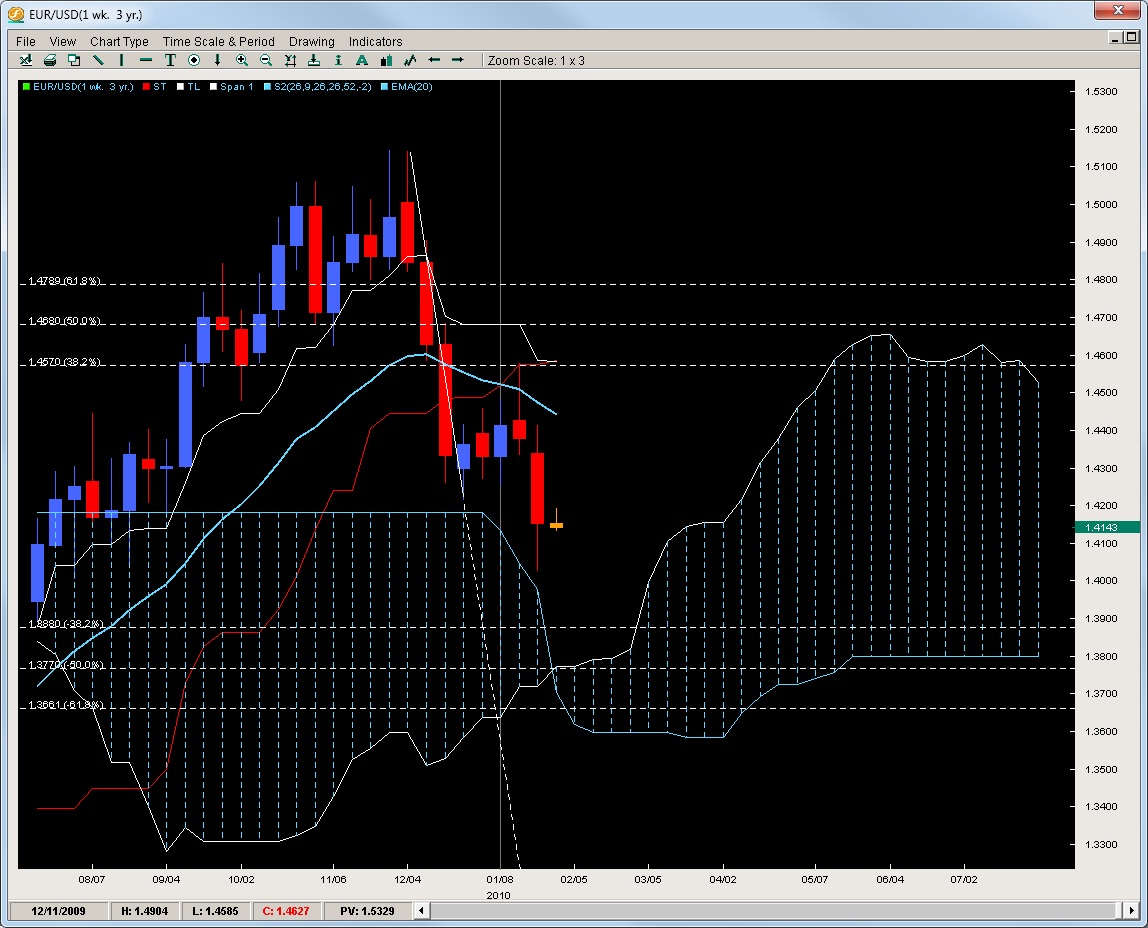
EUR/USD – Clear Resistance/Weak Support
Posting its most aggressive 1 week decline in over a month, the pair has found mild support in the end of the week to bounce a tad. The bounce is not strong and is consistent with a combination of profit taking and corrective behavior. The pressure is still on and we expect any gains to be tempered by the 20ema which is now pointing decently south. The problem for the EUR/USD is more about a lack of support combined with clear lines of resistance. This along with the Kumo now way below at 1.3770 suggests the first major attempts to support this pair will not come for another 275pips below or more. Treat rallies as selling opportunities until we reach the kumo top down below. Only then would decent buys be considered but the pair may be in for some mild correction in the first half of this week.
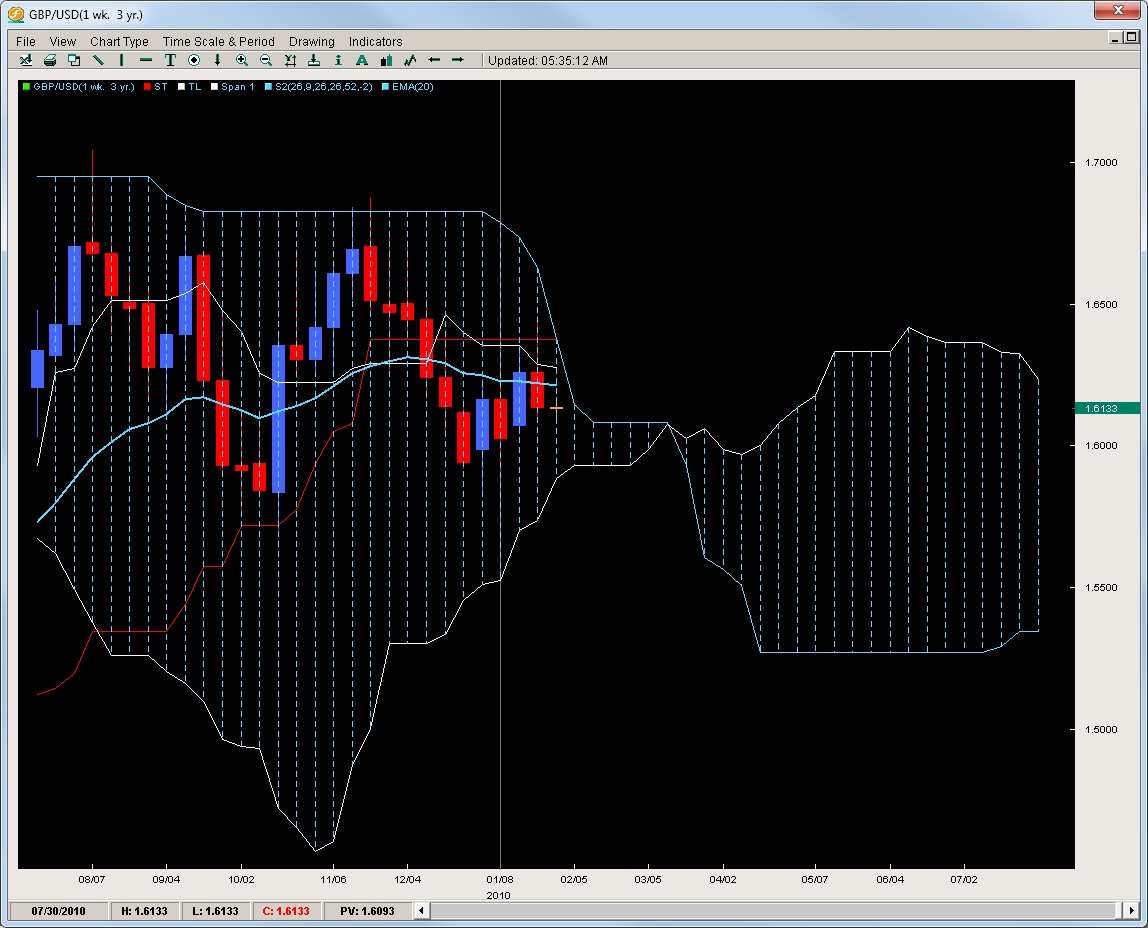
GBP/USD – Messy like a 6yr-old’s room after too much chocolate intake
We almost considered not writing about the GU this week as the pair continues to play inside the Kumo which is getting thinner like the character in the Stephen King novel day by day. The lines are all flat and there is no momentum on either side of the market. Last weeks gains were moreso due to EUR/GBP buying instead of straight GBP/USD selling. The pair does appear to be caught in a bear flag pattern and all three of the lines (20ema, Tenkan, Kijun) are all above so the picture suggests the next likely break to the downside. We suggest light positions until more clarity arrives as some cautious shorts could be attempted at the weekly Tenkan or Kijun.
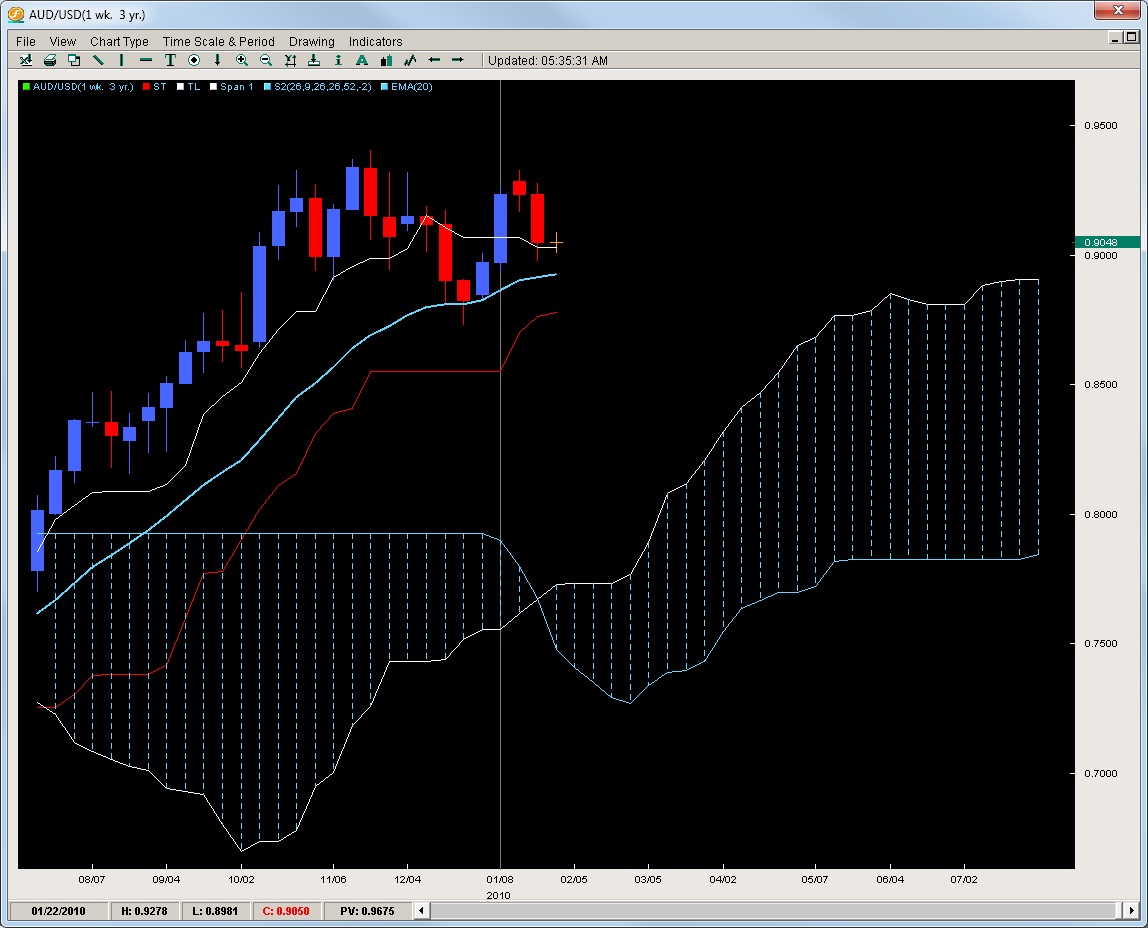
AUD/USD – Confirming the Failure
After failing to make it to the previous highs, the pair has followed it up with some strong selling to find a small base of support at the Tenkan. We feel this will be a lesser test and the more important one the 20ema which has held the last bounce. If it holds again, since it is climbing it will further build up the wedge pattern and suggest a possible continuation. A failure at the 20ema allows the pair to test the Kijun line which it has not done since April of last year. Its too late to sell and the only real technical buys offer themselves at the 20ema but caution is advised. Any large sell-offs will likely get picked up by the Kumo around the 8000 range and allow the pair to make another run at the 09′ highs.
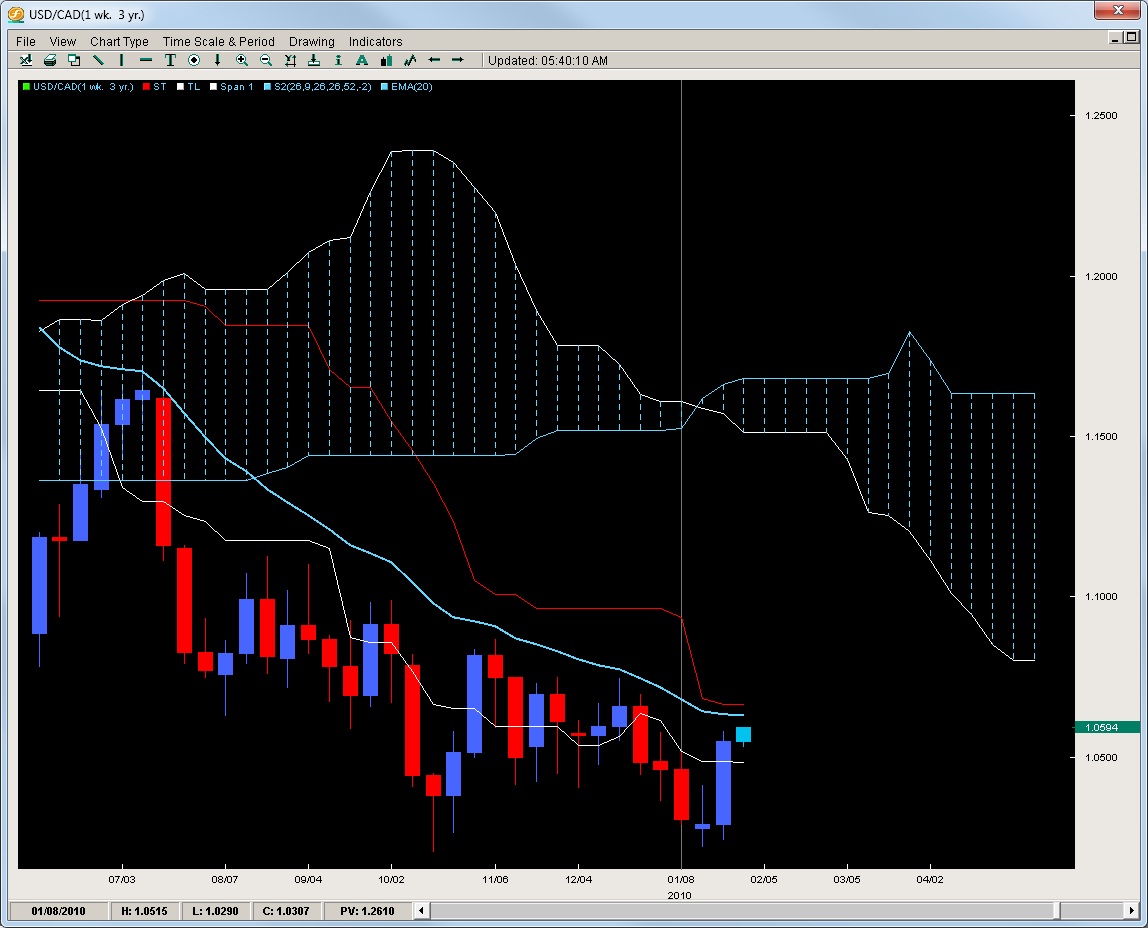
USD/CAD – Making a Claim
The USD/CAD is really trying to do something it has not done in a long time – break and close above the 20ema. The pair has had its closest close to the blue line since July of 09′ and its posturing up like its tired of the suppression. The good thing about breaking the 20ema here is the Kijun is so close it will not really need additional effort to take out both of them so its likely to be a 2for1 situation. Should this scenario unfold, the pair might get aggressively bullish as it would ignite technical buying. So far, in the last 6mos, the pair has only touched the 20ema once which led to a serious rejection of 800+pips in less than 3weeks. We feel this week or next is probably one of the best chances for bulls to get some fresh air to the upside. Aggressive sells could be placed on a 20ema touch but its not our cup of tea. Any major rejections offer another chance to buy around the low 1.02’s for another 400pip climb with little risk to the downside.
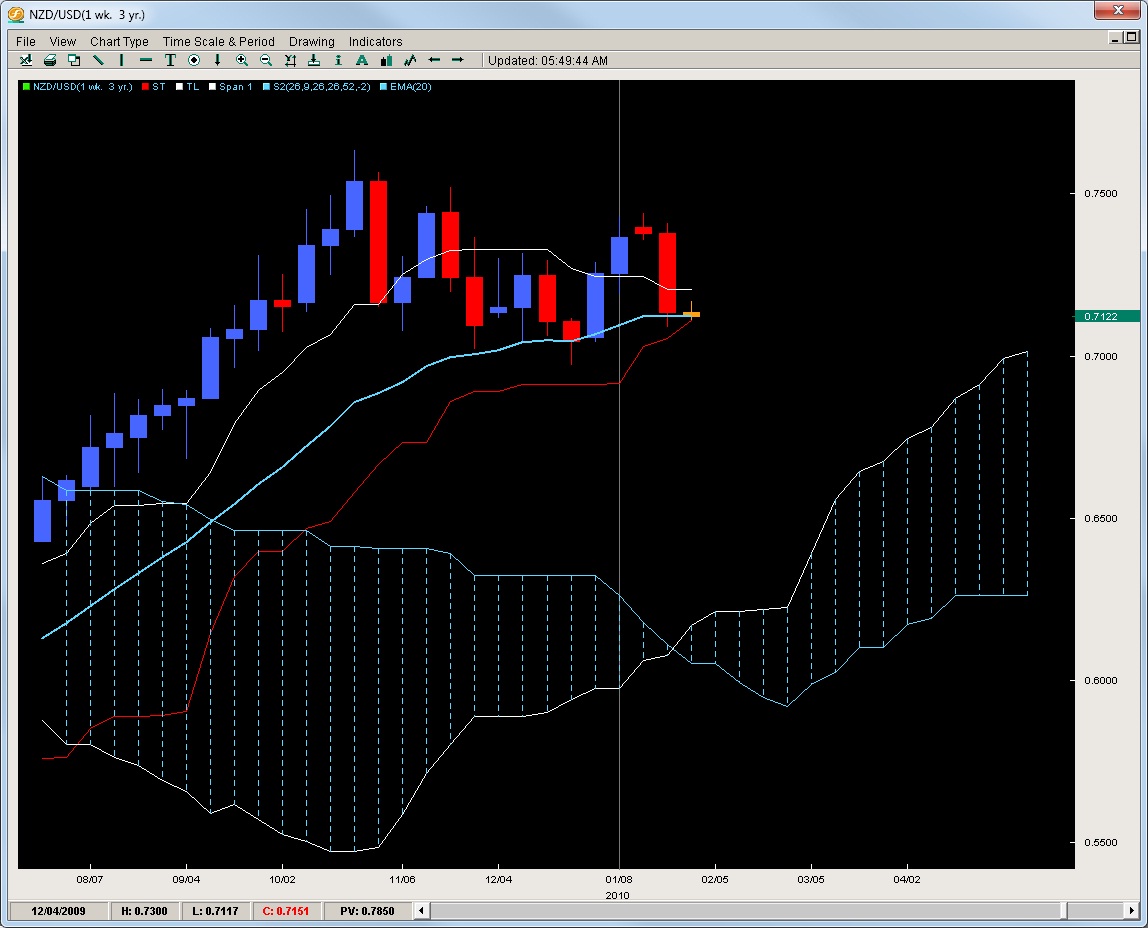
NZD/USD – at a Critical Line in the Sand
Closing right on top of the 20ema and now the Kijun, we feel this is likely the best place for bulls to come back in as both lines have held since late March last year and this is the most contact they’ve had with these lines in a long time. Last weeks selling was strong and none of the lines offer any major testimony as to the bullish prospects. The Kumo is sitting below another 750pips from the current level so we feel a weekly close below the Kijun will likely send this pair to .6560 and .6300 with 7000 holding up the last defenses for the bulls in the medium term. If someone wanted to buy, this is the only place left for a while as any prints below here suggest a fall is probably on its way till at least the end of Feb.
Chris Capre is the current Fund Manager for White Knight Investments (www.whiteknightfxi.com/index.html). He specializes in the technical aspects of trading particularly using Ichimoku, Momentum, Bollinger Band, Pivot and Price Action models to trade the markets. He is considered to be at the cutting edge of Technical Analysis and is well regarded for his Ichimoku Analysis, along with building trading systems and Risk Reduction in trading applications. For more information about his services or his company, visit www.2ndskies.com.
