Capre’s Weekly Forex Report
EUR/USD
Bouncing off the weekly Tenkan and keeping true to the pattern to date, the pair has yet to close below the weekly Tenkan since April, so anyone looking for a buy should target bounces off the Tenkan while taking profit at the 1.5000 level as price has yet to actually close on any weekly basis above this level. However, if the Tenkan has its way, it will force the pair to do so; hence we are coming around the last turn towards a make or break time for the pair. If 1.5000 is going to hold, we feel the breakdown will occur this year, but if the pair can manage any weekly close above it, we suspect the next bull leg will be coming. Until then, the upside is getting pinched as rejections on any major attempts to close above 1.5000 have been consistent so buy on dips on the aforementioned line until the make or break happens with the close above 1.5000 or the close below the weekly Tenkan.
GBP/USD
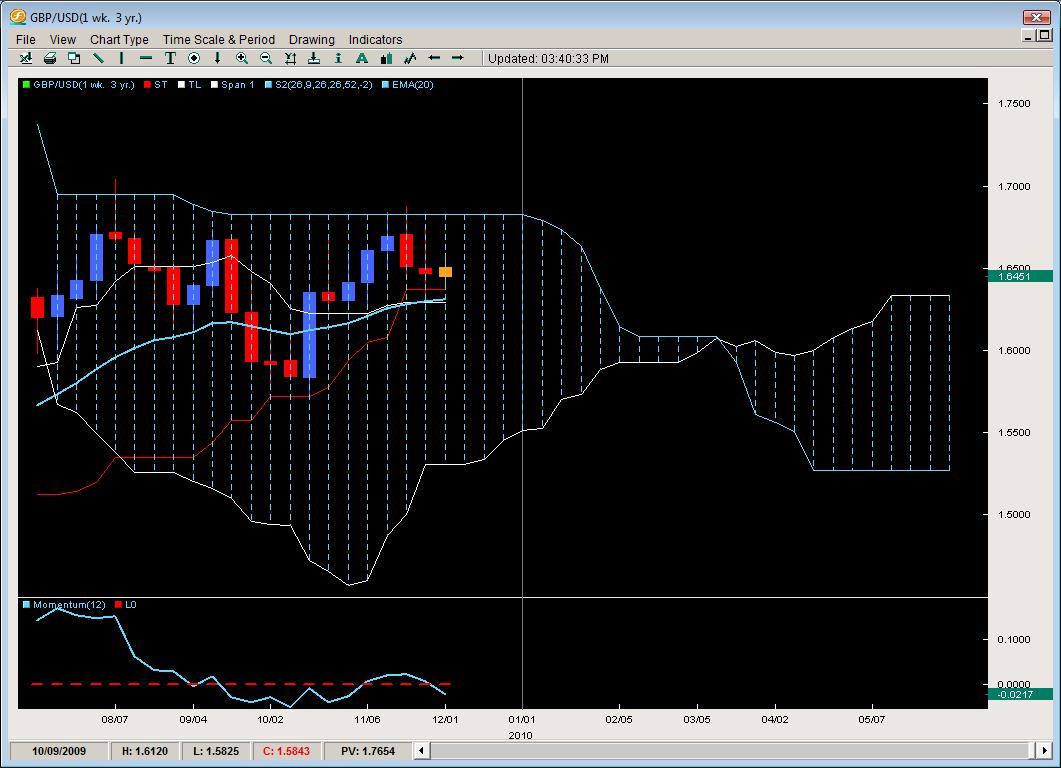
Stuck between the Kumo and the 20ema (along with the Tenkan and the Kijun) the pair is only 4 weeks away from entering a really complex Kumo structure which flips, twists and goes anemic all in the early days of 2010. Also failing to close on any weekly basis above the Kumo, we have a clear rejection zone for the bears while the bulls are really close to their nearest buy level (20ema, kijun, tenkan) line all posting up around 1.6300 which is a solid price base. We feel this is the most important floor for the bears for the month of December. If this breaks, we feel there is little to stop it except for 1.6000 and 1.5700 on the downside. Any weekly closes above the Kumo suggest it should use the flat top as a base for things to stabilize and if they feel comfortable there, then a strong leg up for the end of this year will likely ensue however we feel time is really running out for the bulls to make any major headway. We feel it will take a minimum of 2weekly back to back bull closes for this pair to break/close above the kumo and considering liquidity is already starting to pull out of the market, we feel those back to back closes have to be this week and next. If they do not happen, we feel the GBP/USD will likely end the year below 1.7000.

AUD/USD
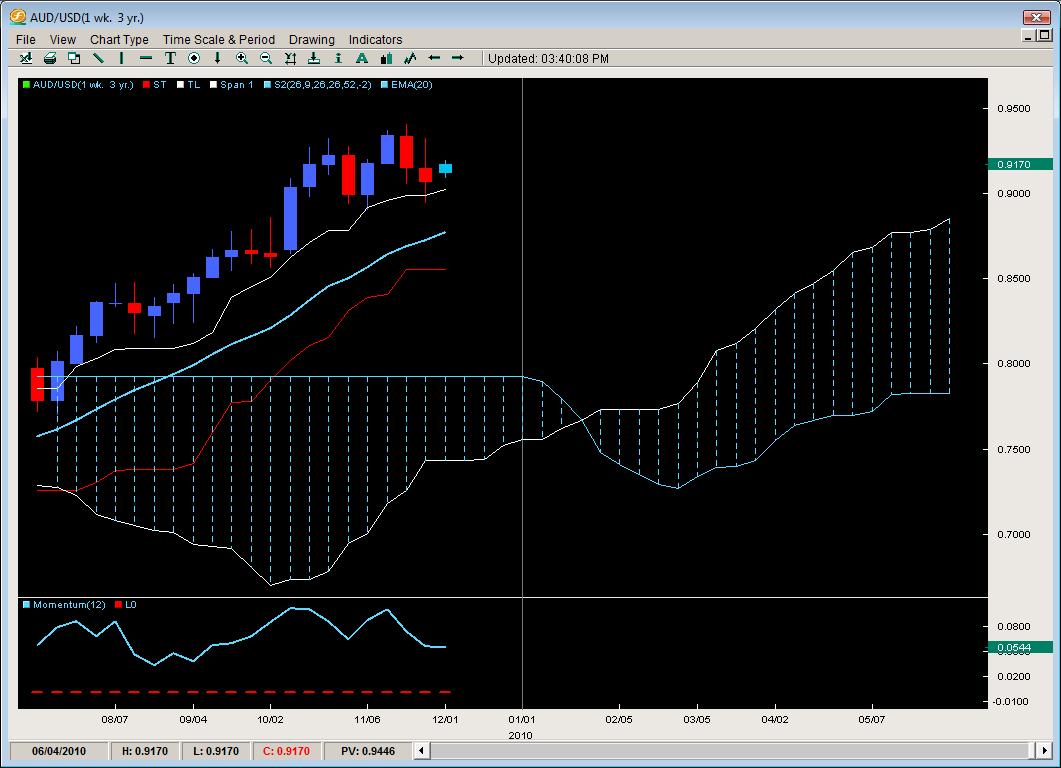
Since March of this year the Aussie has only posted 3 back to back down closes so we feel the likely-hood of it doing it a third time is slim. As expected, the pattern held and the pair bounced off the weekly Tenkan which means the trend is still in place and the line is still climbing just a tad so until we get a close below this, selling is not recommended because you have to guess how much higher it’s going to go as the yearly highs keep crawling up thus increasing the sellers risk each time so instead of playing the guessing game if you are a bear, wait for the close below the Tenkan. On the
other side of that coin is if you are a bull, a simple play off the Tenkan with a stop 66% of the distance to the 20ema (at .8768) while targeting the 9300 level gives you a 275pip target and a 180pip risk but a with trend play. Sellers had to be more sharp, accurate and have wider stops in their plays so we will avoid fighting the currents lest we want to be salmon.

USD/CAD
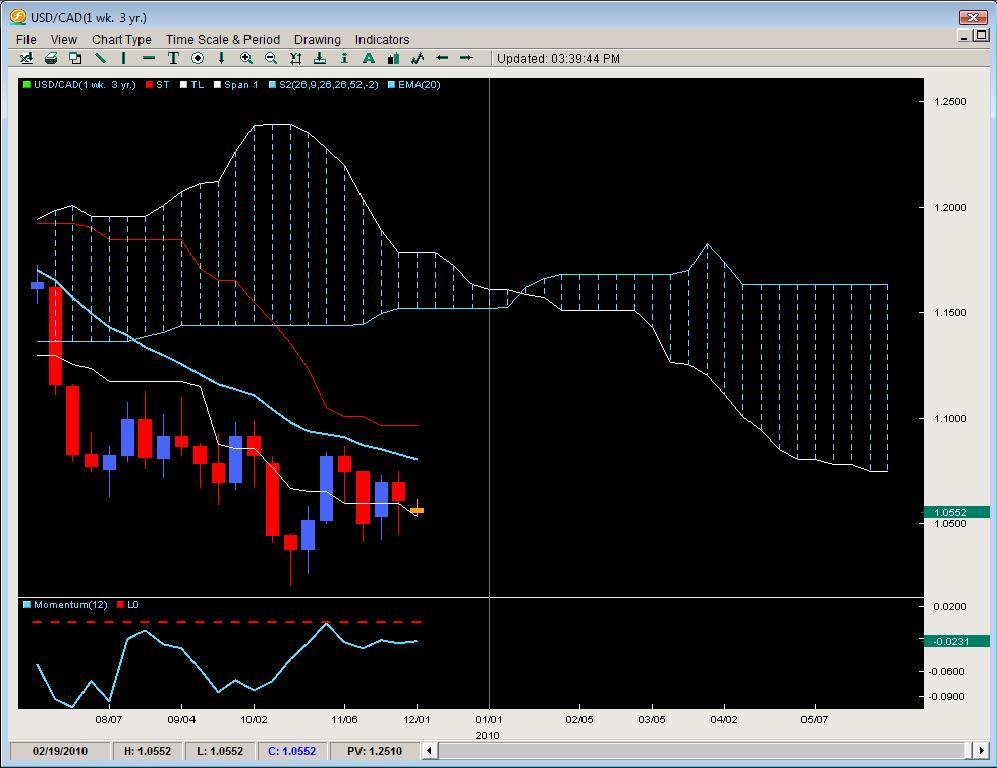
Forming a 7 week wedge with higher lows and lower highs, the pair is stuck between the 20ema and the 1.0200 (yearly low) which makes for a less interesting price structure and something we generally like to avoid. The only real shorts we like on the pair now are off the 20ema and the only longs we like for the pair would be an aggressive one off the low 1.04’s as this has rejected the weekly price 3x now. Overall, the price action over the last 7 weeks makes things a bit ugly and inconsistent so we suggest avoiding anything outside of the levels we mentioned.

NZD/USD
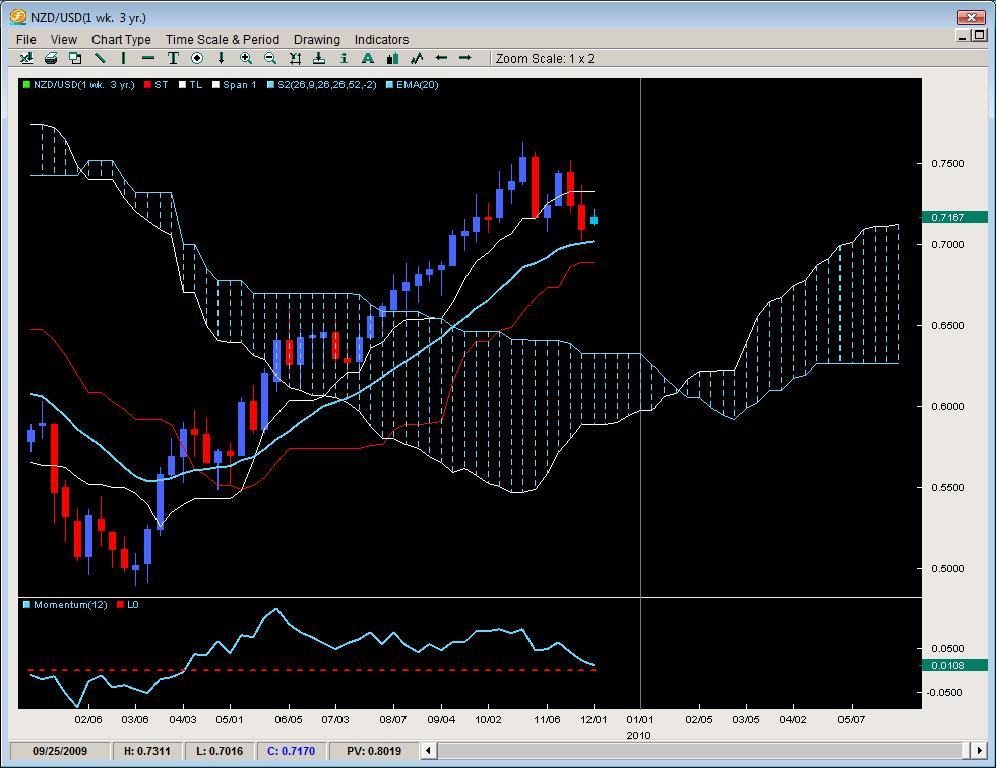
After a failed attempt at a new high or the same high two weeks ago, the pair has started what we feel is likely the beginning of a reversal as the pair has spent a fair amount of time below the Tenkan and made contact (of the 1st kind) with the 20ema. Price did bounce a little of the 20ema but now the Tenkan should act as resistance and with the failed high two weeks ago and the last two weeks of price action producing a lower low from the previous two bull candles, the pair is either entering the beginning of a strong reversal or a downward bull flag which may find a bottom on the Kijun line. Either way, the structure over the last 5 weeks suggest being more bearish than bullish and our first location for attempting shorts would be the weekly Tenkan targeting the 20ema and a stop about 90 pips above giving us over a 3 to 1 R:R ratio.

Chris Capre is the current Fund Manager for White Knight Investments (www.whiteknightfxi.com/index.html). He specializes in the technical aspects of trading particularly using Ichimoku, Momentum, Bollinger Band, Pivot and Price Action models to trade the markets. He is considered to be at the cutting edge of Technical Analysis and is well regarded for his Ichimoku Analysis, along with building trading systems and Risk Reduction in trading applications. For more information about his services or his company, visit www.2ndskies.com.
