Catching a Pullback After a Breakout
In trading, profits and losses can be made in a matter of minutes or even seconds. One of the most important aspects of trading a breakout is timing. This often involves finding a signal(s) to predict the potential price breakout and requires you to properly set up the trade before this move occurs. This process can be very complicated and often times will produce many false signals. Many FX traders spend years trying to optimize the perfect predictor of a breakout but more often than not, this proves to be a futile task.
If you are looking to trade one of the most powerful pullbacks strategies available to traders today, order our newly updated guidebook –The Long Pullbacks Strategy – by by clicking here today.
The reason it is nearly impossible to find a perfect predictor of a breakout is because the reasoning behind a price break is constantly changing. Sometimes it could be a fundamental reason, sometimes a technical one, and often times it is a mixture of both. So with so many different ways for a price to breakout, how are you supposed to figure out when and where it will happen? The simple answer is you probably cannot.
There is good news however; you do not have to catch the first move of a price breakout find potentially successful trades. By understanding the components of a price breakout and the psychology behind it, you can effectively take a lot of the guess work out of trading breakouts and potentially increase your trading edge.
Many new and untrained FX traders often jump into a trade once it has already taken off. In many cases they are chasing gains that they “should have made” or are trying to jump on the bandwagon before it is too late. Jumping blindly into a trade is a recipe for disaster, but luckily for us we do not have to whimsically enter a trade and can use the dynamics of a breakout to catch what I call the “Second Wave.”
The Second Wave refers to a section of a breakout which often occurs shortly after the initial breakout has already occurred. Although there are several times when a price breaks straight in one direction or another, in many cases the price moves in a typical pattern and it is common to see the start of breakout look similar to the following:
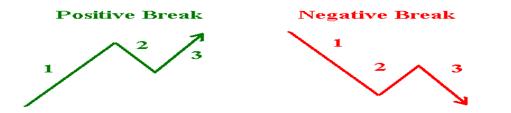
This type of breakout can be broken up in to 3 phases which can be defined as: the Initial Break (1), the Pullback (2), and the Second Wave (3).
The initial break, phase 1, is usually a very sharp and substantial price movement, with the majority of the price action occurring in a relatively short period of time. Although this can often be the largest part of the initial price movement, it is also the hardest part to predict and displays the most erratic price behavior. This price behavior is due to the large inflow of volume and the increase in demand which causes the price to move in a rapid and chaotic manner. Eventually this erratic behavior dies down and the price will try to stabilize. This is our signal that the start of the second phase, the Pullback, has begun.
The Pullback occurs after the initial price move and in many ways acts as a stabilizer of price action. The Pullback is a very critical phase because it offers great insight into the near future of the price action. During this phase you can gauge the market’s reaction to the initial break and based on this, determine the likelihood of the price continuing to move in the direction of the breakout.
There are several different tools you can use to gauge the market’s reaction, however there are two simple rules that you should consider when determining whether or not a trading opportunity is available.
The first rule is: the Initial Break cannot be larger than the Pullback. You can measure this with a simple horizontal line, or for additional information, can draw a Fibonacci retracement pattern from the start to the finish of the Initial Break.
The reason some Forex traders use the Fibonacci retracement pattern is because it provides invaluable information about the likely areas of support or resistance areas that can occur during the Pullback phase. In particular, some Forex traders find that the 38.2 and 50.0 levels to be the most important of the major Fib levels.
Once it is appears that the price has stabilized and it seems like the second phase might be coming to an end, it is time to begin evaluating potential entry and exit points. But before you can enter a trade, you must make sure the second and final rule is satisfied. The second rule requires that some type of confirming signal forms to signify the end of the Pullback phase. In this example we will use the formation of a bullish candle and would use a bearish candle if this was a negative breakout.
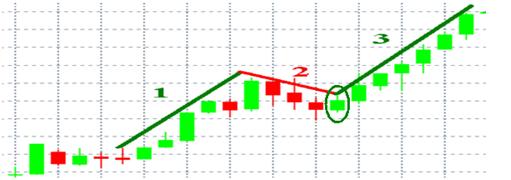
Although in this example we used a bullish candlestick formation, Forex traders can add, change, or modify the specific confirmation signal to meet their particular Forex trading style.
One of the variations to the second rule can be seen in the graph below:
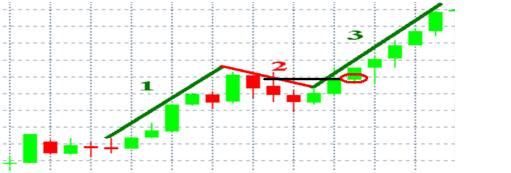
In this example we wait for the price to close above the open price of the second to last candle during the Pullback stage. In addition, a trade will only be entered if there are two consecutive bullish candles. Although this modified rule occurs less often than the original rule, it can provide a more accurate confirmation signal at the expense of a slightly later entry.
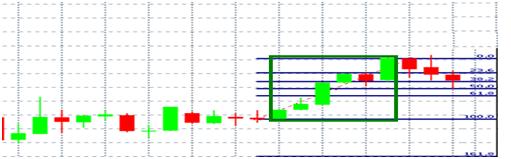
Screening for the right Second Wave trade opportunity is of the utmost importance, but it is just as important that proper risk management is used when placing this trade. To do so a stop loss should be enter slightly below the lowest point of the Pullback stage. Using our last example, the placement of the stop loss would look similar to the following:
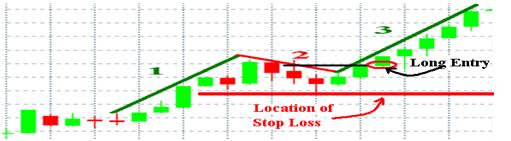
The stop loss is placed here because a move below the second level will negate the pattern of the Second Wave and might decrease the chances that price will continue with the original breakout.
Properly identifying and setting up each phase of the Second Wave pattern is a critical part of this trade setup that requires practice to perfect. If you jump in too early or do not wait for the right signals, you can easily enter into a trade that will not exhibit the same behavior as the typical Second Wave pattern. Once a Forex trader has perfected the Second Wave trade setup, they will have a powerful and versatile tool that provides a unique way to enter in to a breakout trade even after the initial break has already occurred. This setup allows Forex traders the option to easily customize and change the FX trading strategy to meet their specific Forex trading style, making it very easy to implement it in to their overall trading strategy.
Matthew Cherry is a forex market analyst for TradersChoiceFX.com. Many more of his latest articles can be found on the TradersChoiceFX Forex Blog. You can download a free Metatrader Practice Account from TradersChoiceFX and get instant access to a special report that will teach you how to use a Forex bonus program to improve your success as an FX trader.