Come on Man, Give Us a Break
From 1990 to 1997, Kevin Haggerty served as Senior Vice President for Equity Trading at Fidelity Capital Markets, Boston, a division of Fidelity Investments. He was responsible for all U.S. institutional Listed, OTC and Option trading in addition to all major Exchange Floor Executions. For a free trial to Kevin’s Daily Trading Report, please click here.
In the previous commentary (5/3) I said, “The NYA, which is the broadest major index, made a new rally high on the significant 4/15 key time date, but then made a lower high on 4/26, while the SPX, INDU, IWM, MDY, COMPX all made new marginal highs. That negative price divergence by the NYA, in addition to negative momentum divergences by all the other major indexes as they made new rally highs, is obviously a strong red alert for a May correction, with the SPX trading down to at least the 1152.84 .382RT to the 2/5/10 1044.50 low, and major support at the 1150.45 1/19/10 high. That would be only a -5.7% decline from the 1219.80 high, so expect that to be the minimal decline”.
The SPX closed at 1202.26 on 5/3, and then traded down to 1158.15 on Wednesday (5/5) and closed at 1165.89, so the anticipated correction had already begun, accelerated by the sovereign debt developments, and it was from a key price and time zone.
The NYA made the cycle high exactly on the 4/15 key time date, and the SPX key price zone was the 1229 .618RT to 1576 from the 667 3/6/09 cycle low, and the SPX made a 1219.89 high on 4/26, so there was plenty of symmetry that made a reversal the highest probability. The symmetry was confirmed by the extended momentum indicators going into the SPX key price zone.
The initial support zone for the SPX was the 1502.84 .382RT to 1044.50 from 1219.80 and the 1150.45 1/19/10 previous significant cycle high. On Thursday (5/6), which turned out to be the crash day heard round the world, the SPX formed a 1st Consolidation Break Out pattern and broke out below the 1161.40 low on the 10:25 AM bar. It traded down to 1150.26 on the 11:45 AM bar, and bounced off that support zone to an 1159.59 high on the 12:15 AM bar. Keep in mind, all of the accelerated sovereign debt news was out during the morning price action and it was no surprise the anticipated correction was in progress.
However, some selling came into the market after the 1150.26 low was taken out, but it was technical selling because the key support zone was taken out, not panic selling. The selling started to accelerate after the 1:40 PM bar 1145.36 low was taken out, and then the bottom dropped out for 10 minutes from the 2:35 PM bar to the 2:45 PM bar when the SPX went from 1127.71 to the 1065.89 low, and then immediately reversed to an 1132.74 high on the 3:05 PM bar, and pulled back to 1110.16 before closing at 1128.15. The SPY volume on those 3 panic bars was 41.4 million shs (14.5, 13.7, 13.2) and then there was the immediate reversal off the 1065.89 low.
They are not sure yet what triggered the selling, and I am sure you have read about all the suspected reasons, but the one thing I know for sure is that the ridiculous rule between electronic trading (NASDAQ) and electronic trading with Designated Market Makers (NYSE) should be changed. On the NYSE there were many listings on Thursday, including about 5 Dow components that triggered what the exchange refers to as LRP (Liquidity Replenishment Points). This is a NYSE volatility control that curbs wide spread price movements resulting from automatic executions and sweeps over a short period of time.
When this control is triggered it automatically converts it temporarily to an auction-only mode, allowing specialists, floor brokers and customers to supplement liquidity and respond to the volatility. It supposedly took about 30-90 seconds for this process to seek out liquidity, but when the NYSE goes into this mode other markets do not have to honor the NYSE quote, meaning they don`t have to wait for the NYSE to re-open 30-90 seconds later and can trade right through it. To me, this is ridiculous, because when it is a big “fear day” like Thursday there is hardly any adequate liquidity in the electronic markets, and therefore they are subject to easy manipulation by some big players. The unusual decline in prices triggered sell programs, in addition to the algorithm selling triggers.
Regardless of whether it was a program execution error, or else a big foreign liquidation of stocks to buy the USD, or even a coordinated attack by some of the Soros type hedge funds, the bottom line is that our execution system has to be changed so there is only one specific rule for the NASDAQ and NYSE in situations like Thursday. To see stocks trade down to 1 cent in the electronic market because of failed regulation by the SEC is beyond belief.
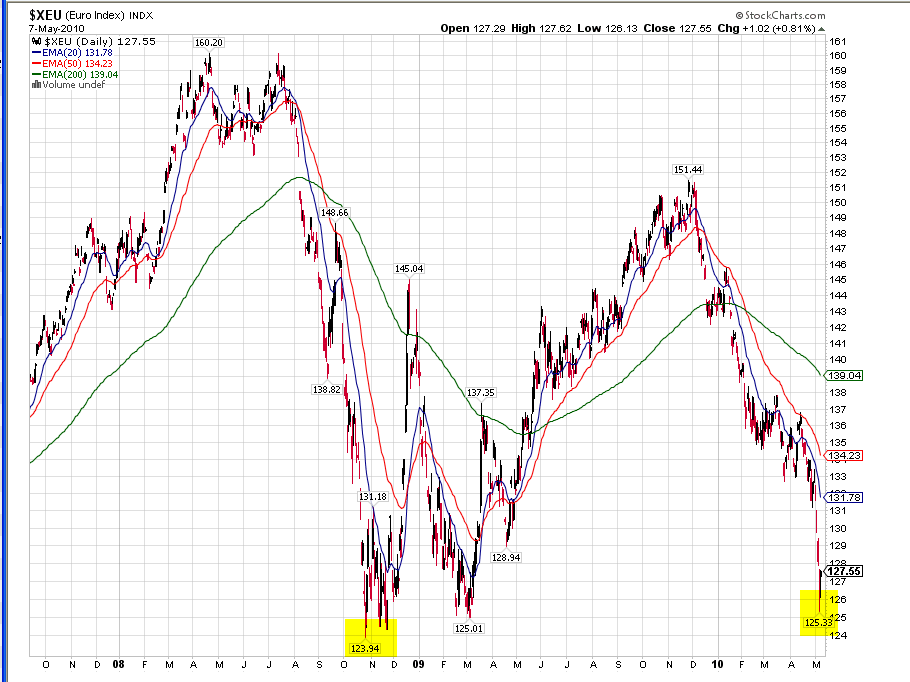
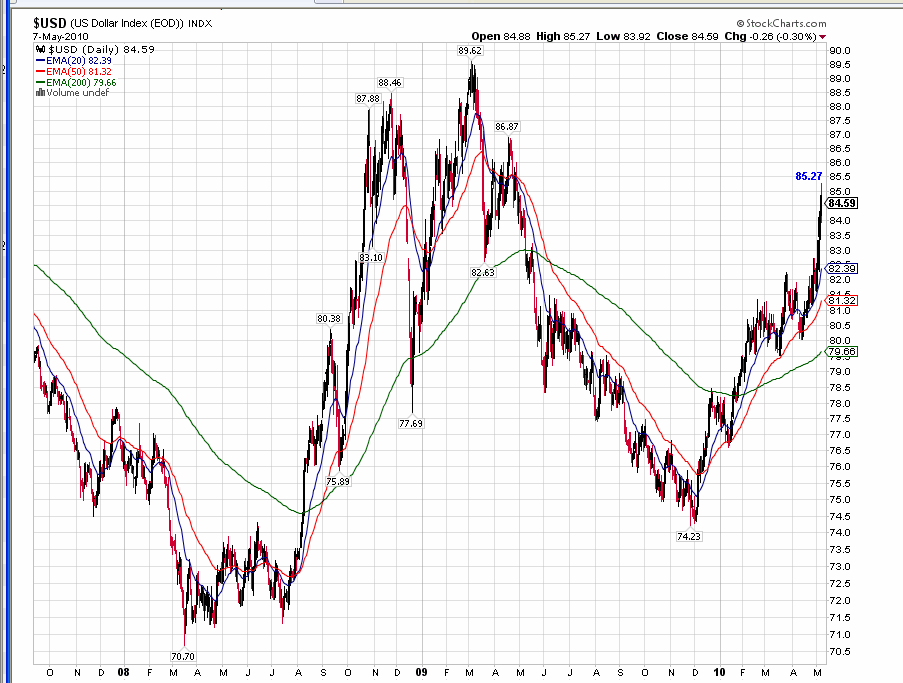
The Euro has completely broken down and hit 1.2513 versus the 1.2394 2008 low, while the USD made a new rally high to 85.27. Gold closed at 1208.50, just shy of breaking out to new all time highs above 1226.40 Regardless of the reasons, the SPX has declined -12.6% from the 1219.80 high to the 1065.89 and closed Friday at 1110.80.
Obama, in addition to his captive main stream biased media, and his TV shills, all tell us that the recovery continues to pick up steam. Does he mean on the downside for a double dip? I am confused. However, on Friday the SPX pulled back to 1094.15 versus the 1093.29 .618RT to 1065.89 from the 1137.61 high (Thursday), and re-crossed the 1099.53 200DEMA so the long entry was carried ever as the SPX closed at 1110.88 The .236RT to 667 from 1219.80 is 1089.34, so it is a tight stop (–1.0%).
Have a good trading day!


Click here to find full details on Kevin’s courses including Trading with the Generals with over 20 hours of professional market strategies. And for a free trial to Kevin’s daily trading service, click here.
