Connors Research Traders Journal (Volume 43): Relative Momentum with Low Vol
In this Connors Research Traders Journal, we are going to explore a strategy that combines momentum and low volatility along with a risk management/trend following overlay. This combination results in an impressive performance over the last 16 years, handily beating the S&P 500, especially when viewed from a risk-adjusted return basis.
The Momentum and Low Volatility Anomalies
Factor investing, sometimes called smart beta, is all the rage these days. Assets continue to pour into factor funds and out of expensive traditional active management (think discretionary stock picking in a given sector – such as small cap, emerging markets, etc). This paradigm shift is no doubt driven by the plethora of academic research showing some factors have historically driven abnormal returns.
Unfortunately, many stand-alone factor funds have failed to live up to their billing.
In this issue, we are going to combine three factors in a sensible way to create a complete trading strategy. This strategy has beaten the SP500 handily for the last 16+ years.
These three factors are:
- Relative Momentum – We are going to invest in stocks that have outperformed in the recent past.
- Low Volatility – We are going to invest in stocks that have had lower volatility in the recent past.
- Time Series Momentum – We are going to turn our strategy “on” and “off” based on time series momentum signals on the index as a whole. We view this as mostly a risk management mechanism, allowing us to sidestep equity bear markets.
The “Problem” with Relative Momentum Stock Strategies
Relative momentum, the observation that the best-performing stocks tend to continue to outperform going forward, is one of the strongest known factors. Unfortunately, these stocks also tend to have higher volatility, and thus relative momentum strategies also suffer from higher volatility compared to the broad market.
While an investor is usually rewarded for the higher volatility with higher returns in a strategy like this, what if an investor wants to dampen the volatility for the portfolio? We are going to solve this problem with our relative momentum + low vol strategy.
Strategy Rules
Below are the rules for the strategy. These rules are check once a month, at the end of the month:
- Take the 500 most liquid US stocks, as measured by the stocks that have the highest 200-day average dollar volume.
- Of those 500 stocks, take the top 40 with the best relative momentum. This is measured by the stocks with the best 6-month (126 trading day) total returns skipping the last 5 trading days.
- Of those 40 stocks with the best momentum, take the 20 with the lowest historical volatility. This is measured by the trailing 3-month (63 trading day) historical volatility (standard deviation of daily returns).
- Invest, in equal weight, in those 20 stocks ONLY if SPY’s 6-month total return is positive. This is our trend following regime filter.
- At the end of every month, we rebalance the portfolio, selling stocks that fall out of our high momentum/low vol list and buying stocks that have since made the list. We don’t take new entries (buys) if the TF regime filter is not passed.
- Put any unused cash into SHY (1-3yr US Treasuries)
A Comment on the Parameters
Rather than optimize the parameters here, we prefer to take parameters generally agreed to “work” in both academic and practitioner circles.
For momentum, both time series and relative strength, 3-12 months has been shown to work well historically. For this strategy, we will use 6-month (126 trading days) for both the relative momentum ranking for the individual stocks as well as the time series momentum trend following regime filter.
As is customary in momentum research, we will also skip the most recent 5 days when selecting stocks that have the best relative momentum. We do this because the nature of markets over this short term time frame tends to be mean reverting.
For volatility, we will take the standard deviation of daily returns for each stock over the past 3-months (63 trading days).
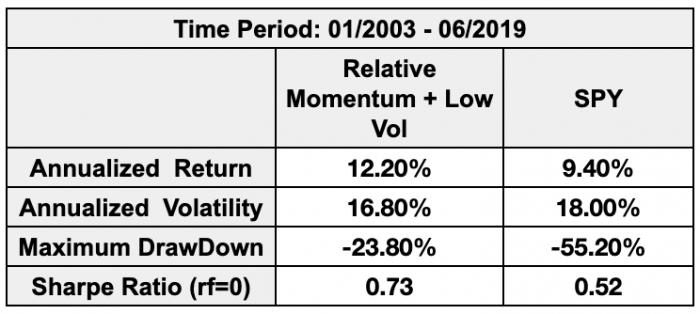
Using those parameters, we get the following test results:
Here are the cumulative equity curves of our strategy vs SPY:
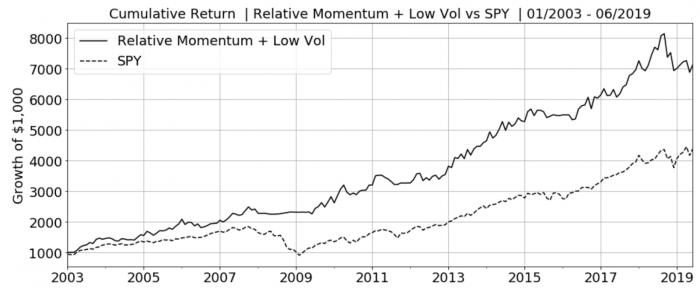
Notice that our relative momentum + low vol strategy had higher returns than SPY (12.2% vs 9.4%) over this time period and this return was realized with lower risk. The volatility went from 18% to 16.8% and the max drawdown went from a horrible -55.2% to just -23.8%. The Sharpe Ratio (risk free rate = 0) went from 0.52 to 0.73. Also, outperformance began immediately and has held for over 16 years.
Conclusion:
Combining some well-known factors in a relatively novel and risk managed way resulted in significant outperformance for our Relative Momentum + Low vol strategy vs the US stock market over the last 16.5 years. Combining factors in a sensible way, as we did in this issue is a smarter and better way to implement factor investing compared to standalone factor funds.
We’ll continue to expand on this in upcoming issues of the Connors Research Traders Journal.
Chris and Larry