Day Trade with The Symmetry
From 1990 to 1997, Kevin Haggerty served as Senior Vice President for Equity Trading at Fidelity Capital Markets, Boston, a division of Fidelity Investments. He was responsible for all U.S. institutional Listed, OTC and Option trading in addition to all major Exchange Floor Executions. For a free trial to Kevin’s Daily Trading Report, please click here.
Commentary for 11/4/11
The SPX finished OCT at 1253.23, going -2.5% on the last day, but still having the best Oct since 1987. The market has had a very tight correlation with the USD, which has obviously been extremely volatile as the Euro-Zone debt crisis continues to grow and it was +1.9% last Fri versus the -2.5% decline in the SPX.
Fast forward to last week and the SPX closed the week 1253.23, or -2.5% and essentially unchanged from the Oct month end 1253.30 close. However, the SPX declined -2.8% last Tues for the second straight meltdown day, and made a 1215.42 intraday low before closing at 1218.28, while the USD was +1.1%. On Wed and Thru the SPX went +1.6% and +1.9% while the USD declined both days. On Thur the SPX made a 1263.21 intraday high and then closed last week -2.5% to 1253.23 as I stated above.
It was obviously a very volatile week with the primary headline news being the Greek referendum etc, and that is about as rational as the market was last week. However, the US market is now just a reactionary tool based on the Euro developments, and that is most evident by the fact that the major indexes had significant NYSE gap openings all 5 days last week, where price was extended to my Volatility Band levels each day, so that set up excellent 1st hour day trading opportunities, and made for a very profitable week.
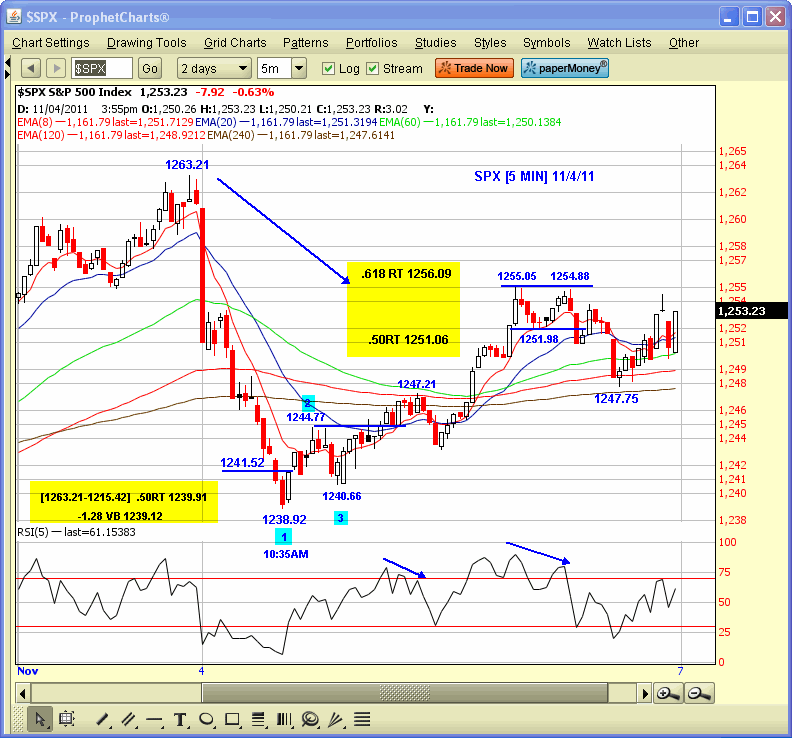
I included the SPX 5 minute chart from Fri and I will take you through the trade logic as seen by the Trading Service members. The SPX had a gap opening and traded down to a 1238.92 low on the 10:35AM bar where was excellent symmetry which makes for higher probability trades. The symmetry consisted of the the -1.28 VB at 1239.12 [80% probability] and the 1239.91 .50RT to the Tues [11/1] 1215.42 low from the 1263.21 high.
The market went trend up from the initial symmetry, but if the initial reversal wasn`t taken, there was a second positive setup, which was the 123 higher bottom strategy following the 1240.66 low, and then if you passed on that entry there was also the 123 trend entry above 1244.77.
The SPX made a double top at 1255.05/1254.88 and formed an 11 bar contracted volatility range with a 1251.98 low. Traders had every reason to exit trades at that level and go short because the range high was at the .618RT zone to the 1263.21 high from 1238.92, and the low at the 1251.06 RT zone. The entry below 1251.98 only traded down to 1247.75 before bouncing to close at 1253.23, but there was plenty of room to either sratch the trade or take a small profit after the reversal from 1247.75.
If you structure your day trading around the various kinds of symmetry, especially the volatility bands, and don`t try to wing it on every bit of news hype, you will develop a very profitable business. You can get a good handle on the different symmetry and simple strategies by taking a one week free trial to the Trading Service where you can also scroll through the archives to see the kinds of trades taken with different kinds of symmetry.

Click here to find full details on Kevin’s courses including Trading with the Generals with over 20 hours of professional market strategies. And for a free trial to Kevin’s daily trading service, click here.
