ETF PowerRatings and Japanese Candlesticks: Strategies for Traders
Can ETF PowerRatings teach Japanese candlestick traders a little something about mean reversion and what it means to “buy the selling and sell the buying”?
Japanese candlesticks are a very popular tool for many traders. Even though Japanese candlesticks do not provide any additional information relative to the more traditional, Western bar charts, Japanese candlesticks remain widely-used among traders of stocks, ETFs, futures and FX.
One of the main reasons for the popularity of Japanese candlesticks and candlestick charts is that they provide a very compelling, easy to read, picture of the battle between buyers and sellers in the marketplace. Strong white (or green) bars, I mean candlesticks, reflect buying strength and project optimism (green is good, right?).
In contrast, strong dark (or red) candlesticks represent selling strength and tend to portend weakness and falling prices. Being able to spot these different signals on a price chart with a simple glance is one reason why many traders use candlestick charts – even if they don’t truly “trade” based on candlestick patterns.
That said, it is hard to avoid the psychological bias inherent in these patterns. Large white/green candlesticks are good and bullish, while large dark/red candlesticks are bad and bearish.
However, things look a little different when ETF PowerRatings are added to the picture. Take a look at this ETF PowerRatings chart of the ^SPY^ and note what sort of Japanese candlesticks accompany the highest ETF PowerRatings of 8, 9 or 10.
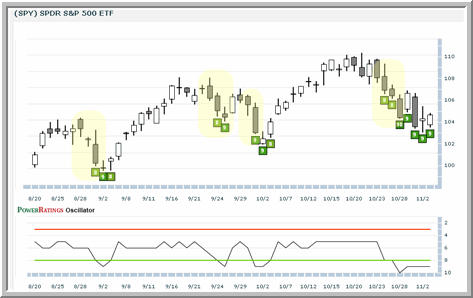
Above, in the example of the SPY, the highlighted areas show instances of multiple dark candlesticks, typically viewed as bearish signals for traders.
Note that the highest ETF PowerRatings tend to occur on days that have dark, sometimes large and dark Japanese candlesticks.
This should not be a big surprise. We know that ETF PowerRatings work by spotting oversold ETFs that are likely to make significant short term gains. Those ETFs didn’t become oversold by themselves. It takes aggressive selling – dark candlestick after dark candlestick – in order to drive these ETFs lower (pushing their ETF PowerRatings potentially higher).
What is interesting, though, is that ETF PowerRatings can help traders who use Japanese candlesticks interpret them more broadly than the traditional “white stick good/dark stick bad” dichotomy that virtually every trader who uses Japanese candlesticks in their trading tends to accept. By checking an ETF PowerRatings chart in addition to their Japanese candlestick chart – or by making them one in the same – traders, especially short term traders, get a better perspective on just what the probabilities are of the ETF market continuing lower or reversing to the upside.
So the next time you are looking at an ETF on a candlestick chart and marveling at a string of ugly-looking black candlesticks, be sure to click over to your ETF PowerRatings chart and see what sort of short term edges those black candlesticks may be hiding. The diamond in the rough behind all those dark candles might be an ETF PowerRating worth knowing.
Did you know that our PowerRatings work for exchange-traded funds too? If you’ve been looking for help in trading ETFs in both bull and bear markets, then our ETF PowerRatings may provide the solution you are looking for. Click here to start your free, 7-day trial today!
David Penn is Editor in Chief at TradingMarkets.com.