Fed Fantasy and Short Term Market Reality
From 1990 to 1997, Kevin Haggerty served as Senior Vice President for Equity Trading at Fidelity Capital Markets, Boston, a division of Fidelity Investments. He was responsible for all U.S. institutional Listed, OTC and Option trading in addition to all major Exchange Floor Executions. For a free trial to Kevin’s Daily Trading Report, please click here.
Commentary for 11/15/10
The SPX had its first losing week since the week of the 8/27 1039.70 low [11 weeks], and finished -2.2% to 1199.21. It was -1.2% on Friday, which was the first day of QE2, and it made an 1194.08 intraday low after a 5 day pullback to the 1195.58 20DEMA, which is the longest pullback since the 7/1/10 1010.91 low, so obviously the Fed is succeeding on its “inflate the assets” objective.
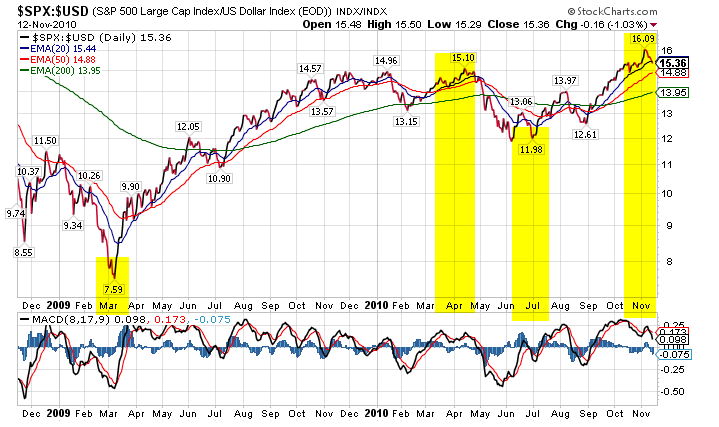
The 5 day pullback was in conjunction with the USD up 5 straight days before the -0.1% day on Friday, and it was +2.5% on the week, so it is still the primary catalyst in both directions. The ratio of the SPX: USD had a negative MACD divergence before the SPX reversed, and the SPX will turn back up when that ratio reverses. I have included the ratio chart in today’s commentary.
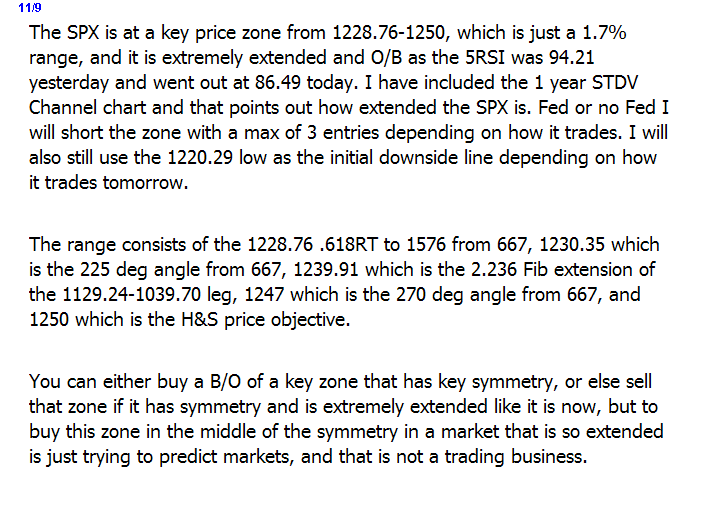
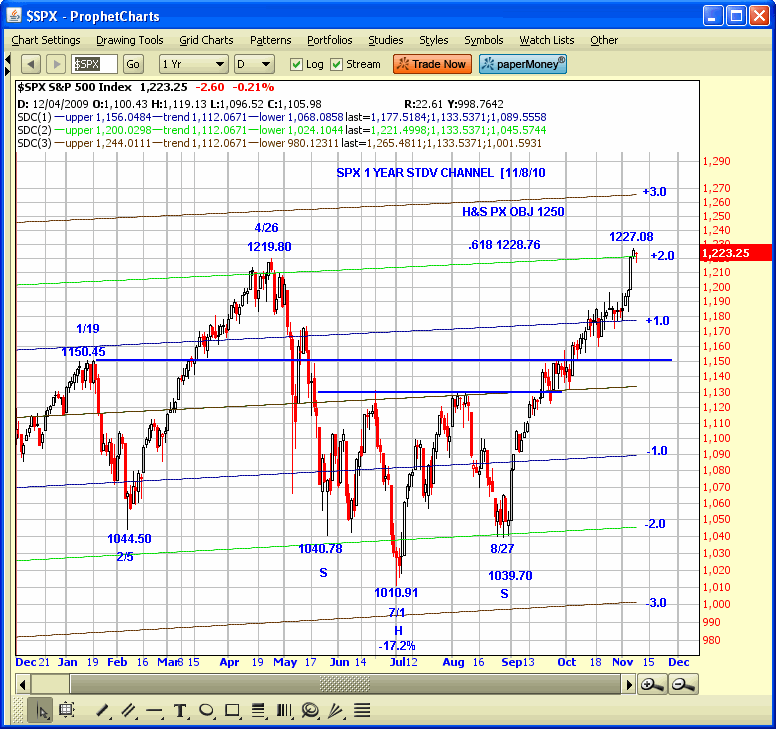
The SPX reversed right at the 1228.76 .618RT to the 1576 bull market high from the 667 bear market low after the 1227.08 high on 11/5. I have included 3 paragraphs below from my Trading Service commentary for 11/9, and also the 1 year STDV Channel chart, so you can see why a reversal was such a high probability from the .618RT zone, in an extremely extended market.
I don’t expect a significant decline short term because of the Fed and the seasonal period, but then again I expected a significant decline in the historically weak Sept/Oct seasonal period after the O/S rally from 1039.70, in the key 8/27-8/20 time zone, but obviously the rally has carried further that I expected, because who knew the Fed, for the first time in my 40 years experience, would influence a market to the extent that it has so far.
If this current pullback has further weakness below the 20DEMA, the next price symmetry is the .236RT to 1039.70 at 1182.79, the 50DEMA at 1167.10 and the .382RT at 1155.39, in addition to the 1150.45 high of 1/19.
There is no surprise that the extended market reversed on some sell the news profit taking, but the game will remain the same in that the USD will determine the short term direction of the equity and commodity markets.
Have a good trading day!


Click here to find full details on Kevin’s courses including Trading with the Generals with over 20 hours of professional market strategies. And for a free trial to Kevin’s daily trading service, click here.
Introducing our newest product The Machine. Click here to sign up for a free, online presentation by Larry Connors, CEO and founder of TradingMarkets, as he introduces The Machine, the first and only financial software that allows traders and investors to design and build quantified portfolios.
