High Probability Trading Report: Edges in Overbought ETFs (SPY, QQQQ, IWM, XLF, EWZ)
The race to the 200-day continues, as more and more exchange-traded funds (ETFs) that had been trading below the 200-day are climbing higher and higher – and deeper into overbought territory.
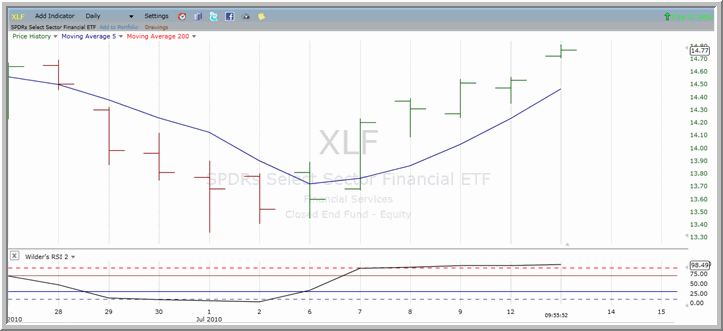
Looking at the top volume ETFs, ETFs like the ^SPY^ and the ^QQQQ^, we see funds that have closed in overbought territory for many days in a row. Heading into Tuesday’s trading, the SPY had closed in overbought territory below the 200-day for four days in a row – and is well on its way to a fifth. The same is true for the QQQQ and the ^XLF^ (below).

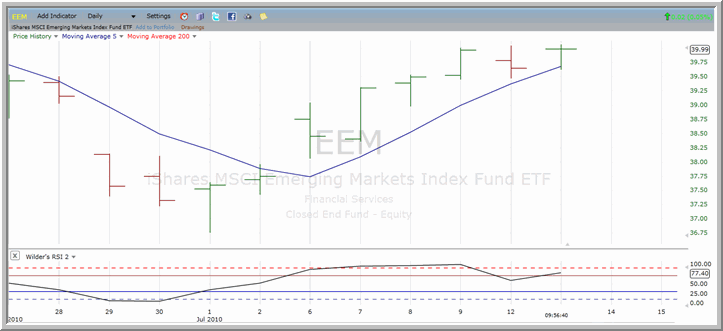
Other funds that have not been as consistently overbought have nevertheless also bounded higher in recent days – including early trading on Tuesday. This includes the ^IWM^ and the ^EEM^ (below).

Up until the point that these funds close above their 200-day moving averages, the historical edges remain on the short side. Through thousands of simulated trades involving hundreds of liquid, widely-traded ETFs, our research continues to show that rallies below the 200-day moving average tend to have less staying power than rallies above the 200-day.
This is why high probability trading means avoiding or selling short markets that are overbought below the 200-day.
Yet, the fact that markets are racing to the 200-day – and potentially working to re-establish the bull market that began in the spring of 2009 – means that traders are understandably hesitant to bet against markets that, in many instances, are ramping higher.
One strategy here is to avoid selling short those funds that are within 1.5-2% of the 200-day moving average. Although the data does not necessarily distinguish between pullbacks or overbought rallies that are closer or farther from the 200-day on a relative basis, it is clear that the additional volatility that appears as stocks and ETFs approach the 200-day can be a distraction to traders and a magnet that can make markets act in unusual ways (Larry Connors discusses this at length in this morning’s Daily Battle Plan, by the way. Click here for a free, one-week trial and to read today’s market commentary.)
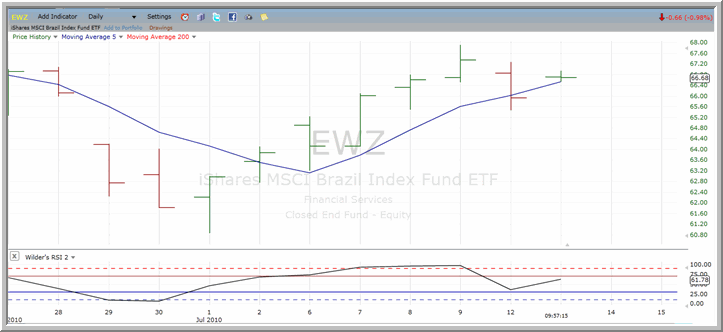
Examples of these kind of markets – on the overbought side – include the ^EWZ^ (below), the ^EFA^ and even the ^FXI^.

If you’d rather look on the buy side, the pullbacks in many inverse leveraged ETFs should be worth paying attention to. These include some very, very oversold ETF markets like the ^SDS^ and the ^TZA^.
With Larry Connors’ High Probability ETF Trading Software, short term traders have access to the same kind of “buy the selling, sell the buying” trading strategies that professional traders have used successfully for decades.
Click here to start your free trial to Larry Connors’ High Probability ETF Trading Software today!
David Penn is Editor in Chief at TradingMarkets.com.
