How I Use the Past to Predict Market Direction
We’re all familiar with the phrase “there’s nothing new under the sun.” Perhaps the ancient authors of Ecclesiastes were indeed traders. A technician pays extraordinary homage to the concept of past price action foretelling the future.
While history seldom repeats exactly, there is no shortage of uncanny similarities between like events. Because markets are organic-price being the mere product of humans buying and selling-it only makes sense that Market Memory is as real as our own recollections surrounding fundamental changes in valuation. Some of us remember better than others. Hence the need for the chart.
Click here to order your copy of The VXX Trend Following Strategy today and be one of the very first traders to utilize these unique strategies. This guidebook will make you a better, more powerful trader.
Technical traders like myself who look to the past for analogous market action to the present, engage in a study called fractal analysis. Without filling this article with hundreds of additional incomprehensible words you can get a pretty good definition of fractal at this link.
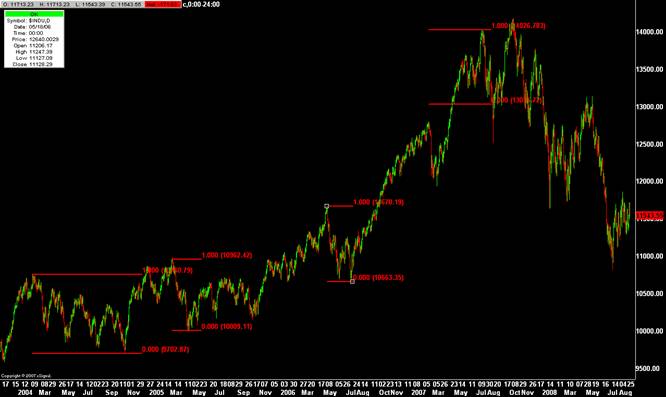
The concept is easy. Prices move in virtually exact measurements often enough that identifying fractal points provides context for what should or shouldn’t happen if a market is running to form. Below is a chart of the Dow Jones Industrial Average from 2004 to its current levels.

What do we notice? In 2004 the Dow was in a 1000pt range. The next 2 years the market twice broke 1000 points again only to see a bottom form. Subsequently what has occurred on breaks greater than 1000 points? Immediate follow through to further downside. We can deduce two things. Longer time frame participants were buyers on dips of 1000pts and some of those participants had sell stops for protection on breaks greater than 1000pts. These fractals are evident on all time frames and in all markets.
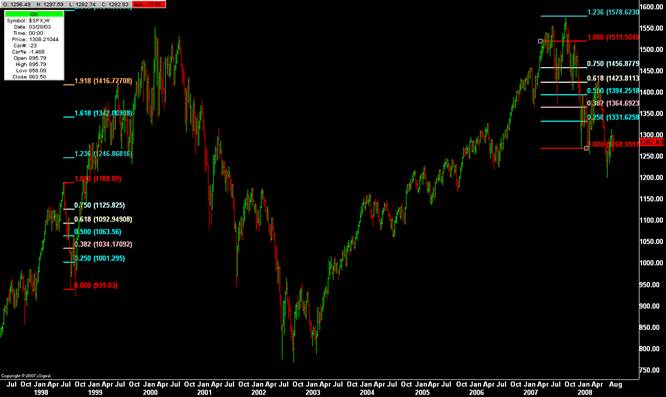
My favorite fractal references involve comparing a current fundamental climate to a parallel in the past. Many astute trades couldn’t help but note the similarity between the beginning of last year’s sub-prime melt down and the 1998 LTCM crisis. Certainly a near set of fundamentals. Two different multi-year bull markets suddenly caught in the cross hairs of counter-party risk, rumors of bank failures and an aggressively accommodative Fed. I did well on each segment of the break by letting the knowledge my charts had of 1998 feed me the levels.

In 1998 SPX had an initial 250 point drop from its July high (made eerily within days of the anniversary 2008 July high). What then happened this past year? On the right side of our chart you’ll see that SPX had a 252 point break on its epic plunge from mid December to its swing low on January 24th. You’ll also observe that the entire July/07 to Jan/08 SPX move was a fib extended 1.23 of the 1998 move.
Kurt J. Eckhardt has been trading since 1982 when he began his career as an active floor trader in the CBOT Treasury Bond pit. Kurt is President of Eckhardt Research and Trading and its subsidiary Agility Trading. Agility offers both individuals and funds cutting edge technical strategies along with high performance instruction. For more information go to www.agilitytrading.com or email Kurt at kurt@agilitytrading.com.
