How to Find the Best MetaTrader EA – Part 1
There are hundreds of trading robots out there, many of which claim to make very large profits on a consistent basis. It can be very difficult to weed through the noise and actually find an expert advisor that will provide you with stability and hopefully positive returns. Throughout this article I will show you a multitude of statistical ways to search for the best performing Metatrader EA.
As you know, when making any educated decision it is important to be able to rate based upon different forms of criterion. When searching for the right trading robot there are tons of measures and values that we can analyze. I’ve chosen to highlight some of the statistics that I find to be very important when selecting an EA.
Click here to order your copy of The VXX Trend Following Strategy today and be one of the very first traders to utilize these unique strategies. This guidebook will make you a better, more powerful trader.
In my opinion, when focusing on quantitative statistics, the primary focus should be on both performance and risk. Keep in mind when considering these factors; it’s extremely important that you keep your own risk tolerance in mind.
Measuring Profitability:
First off, it is quite obvious that you should not look for an EA that has not produced historically positive returns. It must be mentioned here that historical trading performance is not indicative of future performance, yet a Metatrader EA without historically positive performance should be immediately eliminated.
However, simply selecting a profitable trading robot without delving into other measurements can lead to detrimental results. Profitability needs to be quantified in order for you to compare it with other historically profitable EAs. The equation that I’ve found to be most useful is known as the profit factor, which can be calculated as: (profit-commission)/(max drawdown+commission). An expert advisor with a profit factor that is less than one should be eliminated, as the returns do not justify the amount of risk taken on. Take a look at the table below for the stats of three hypothetical trading robots:
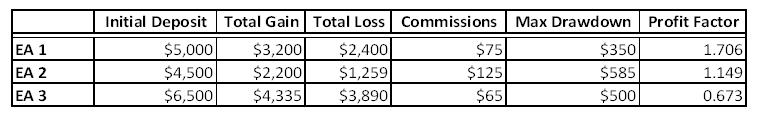
Although I’ve provided limited information here, it’s already possible to eliminate EA3, as its profit factor is less than 1. Taking a closer look at EA3 will show you that it actually did generate positive returns, but the returns did not outweigh the amount of risk taken on. This risk can be associated with Max Drawdown, which is a very critical statistic.
An Explanation of Drawdown:
One of the most important risk indicators to view when analyzing an EA is the drawdown. Essentially the percentage that an EA loses from its last high to its next low is known as the drawdown. The expert advisor’s drawdown gives you an overview of the volatility to expect when running this robot, and gives you an idea of what you might expect to see as far as potential drops in account value.
Initially it’s wise to take a look at the equity curve. A historically choppy equity curve represents a Metatrader EA that is volatile, while a smoother curve represents a historically more stable EA. When comparing trading robots it’s beneficial to further quantify this drawdown measure, starting with the Max Drawdown. Max drawdown gives you a feel for a worst case scenario. Now, imagine if this worst case scenario occurred on the very first trade. Would you feel comfortable taking on this amount of risk? If not, then it would be sensible to eliminate this EA.
A second drawdown measure is known as the average drawdown. This calculation is found by summing up each individual drawdown percentage and dividing by the total amount of drawdowns encountered. You can imagine, this can be quite tedious, but most EA vendors will be able to provide you with this statistic. After you have attained the average drawdown you’ll gain an idea of the average peak to trough cycle that is likely to occur, and whether this meets your risk parameters.
The third component of drawdown is the analysis of drawdown recovery. This is simply the average time it takes for your EA to come out of the negative territory. An EA with less volatility will often take longer to recover from a drawdown, while more volatile EAs may recover quicker. Although a short recovery period may seem desirable, keep in mind that this may be due to frequent and severe drawdowns.
By combining these three drawdown measures you can gain an encompassing idea of the inherent risks associated with the EA. When further combined with performance measures you will get a good idea of what to expect with a particular EA.
Accuracy and the Win/Loss
Accuracy is a straightforward measure, calculated as the total number of winning trades divided by the total number of trades. Although accuracy is a vital part of assessing the performance of an EA, it can often be very deceptive. Two common problems with accuracy are the underlying scope and the assumption that a high accuracy leads to profitability. First off, when calculating accuracy, you should have a minimum scope of 50 trades, but it’s often smart to gain access to a larger trade base. EAs often go on winning or losing streaks, so it’s important to analyze as many trades as possible considering that EAs often revert to their mean accuracy.
To mitigate the risk of the second misconception (that a high accuracy equates to profits) you can calculate the average win % and average loss %. These are simply the percentage of winning trades versus the percentage of losing trades.
Expectancy of Performance
By combining the two measures I mentioned before, accuracy and the average win/loss, you are able to calculate a measure that will help to forecast future performance. This measure is known as expectancy. Again, historical results are not indicative of future performance. Expectancy can be calculated as: (Accuracy * Average Win)/((1-Accuracy)*Average Loss). Expectancy shows you a projected average return for each trade over the life of your EA. Expectancy less than one shows that the EA historically loses more often, and is a surefire way to eliminate the robot. Each trade will of course vary on a trade by trade basis, but over the long run the expectancy is what you might be able to anticipate. Keep in mind the amount of trades taken into account when analyzing expectancy. For example, an EA with an expectancy of 4.3 may seem better than an EA with a 1.1, but if the EA with a 1.1 value made ten times more trades, it would be considered a more successful trading robot.
Although I’ve covered what I believe to be some of the most important backtesting statistics, remember that there are many tools at your disposal. The benefits of quantitative analysis are very important; yet qualitative analysis also plays an important part in the selection of your EA. Qualitatively rating an EA is often grossly overlooked, and I will bring this subject to light in my next article!
Alex Nekritin has a been a professional trader for over 10 years and is the Founder and President of TradersChoiceFX.com. TradersChoiceFX is a Metatrader Forex Brokerage firm that is able to enhance their clients FX trading success through their through their Forex bonus program. TradersChoiceFX also strives to set clients up with the ideal environment for their Forex strategy. You can download a free Metatrader Practice Account from TradersChoiceFX and get instant access to a special report that will teach you how to use a Forex bonus program to improve your success as an FX trader.