How to Identify Targets for Your Trades
It’s not uncommon to hear traders talk about risk/reward ratios in their trading. They’ll say things like “I look for 3:1 trades” or something to that effect, meaning they want to take trades where the upside is at least three times as large as the downside. It’s one of those metrics that combines with things like win rate to develop a view on the effectiveness of a trading approach.
Here’s the rub, though. Coming up with the risk side of the ratio (the: 1 part) is generally the easy bit. That’s where the trader is going to put their stop (for most traders). Ideally, it represents a point at which the price action says the odds of the expected positive result are not very good. For some that’s a fixed distance from entry, while for others it’s more variable. Regardless, it’s something most traders (eventually) do without much trouble.
The other side of the equation is a bit harder, though. That’s the reward side, meaning it’s where the market is expected to go if the trade works out according to plan. A lot of traders struggle with this aspect of things, but there’s a way to pick out target levels fairly quickly and easily.
First, a little discussion of what’s happening behind the price action.
The markets exist to serve one purpose – to facilitate transactions. As such they operate in a manner which acts to generate maximum trade flow. That means prices go to the levels which most readily bring buyers and sellers together. A market won’t spend very long at a point where transaction volume is light, and will tend to linger where lots of trades are being made. That’s how the exchanges make their fees and how market makers grab the most bid/offer spread profits.
What all this boils down to is that the market will tend to be attracted to levels where it previously did a lot of transaction volume. Why? Because they are proven points of mutual value to both buyers and sellers, and market makers will continue to work prices to there until they are given evidence that things have changed.
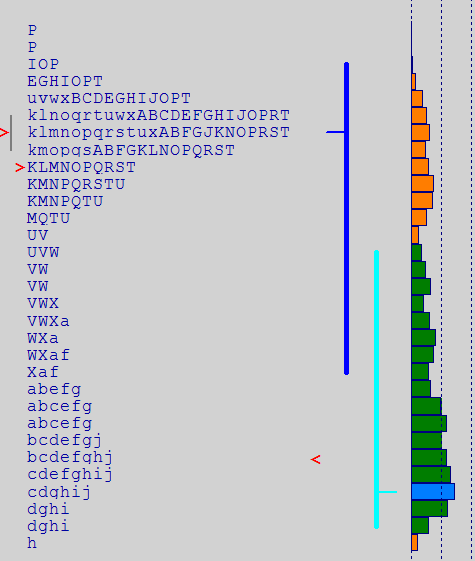
With that in mind, we can turn to the charts to tell us where these attraction levels are. Price/Volume distribution charts are the ones which most readily provide us the information we require. Here’s an example:

This is a recent price distribution chart of the S&P 500 index. Each distribution shown depicts one trading day. It is created by compressing together all of the 30 minute bars (each letter code is one of those bars). Looking at this chart it’s very easy to see the high density trading levels. We can also see how in the latter part of the chart the market moved right back into the major distribution areas from the earlier part of the week.
For example, on 11/21 we can see a distribution develop at the lower end of the range, but then late in the day there was a break higher which pulled the market right back into the major distribution area of 11/20. Similarly, the follow-through on 11/24 drove the market back up into the area of high price density from 11/18 and 11/19, where it settled for two days.
Think about as situation on 11/21 where a trader had reason to get long the market in the 760 area. Because there’s the high density area in the upper 780s through to about 800, the trader has a good idea of where the market should go if the expected rally comes about. As it turns out, in this case the market was very strong and continued to run higher on the following session.
A great many charting packages don’t offer a price distribution option (by any of its many names), but there is another option which can be used. That’s a Volume at Price chart like this one.

This chart shows pretty clearly the price levels where the largest amount of volume has been done over the given timeframe (10 days, hourly). The 90 level is clearly a strong attraction point which can be used as a great target for someone placing a trade in the direction of it (long from below, short from above).
The thing, though, is that one doesn’t even need some fancy chart or volume study to be able to see the major target levels. By stripping out the volume and just looking at the bars, it’s easy to see those high density price levels.

It’s definitely better to look at the volume side of things if at all possible, because sometimes it will tell you a different story than just price. This chart of the e-mini S&P futures shows a perfect example of that.
Notice how the volume distribution on the right peaks in the lower area of the price range, whereas the price distribution peaks in the upper part. The e-minis trade much more actively during the NYSE trading session, but that’s the minority portion of the day in terms of time, so sometimes price spends a lot of time at a level, but doesn’t actually trade a lot of volume there.
That said most of the time when dealing with a more evenly traded market – like a stock during the main trading day – the price distribution will closely match the volume one. As such, if volume isn’t available, such as in forex, looking at price (either the distribution or the density of bars on a standard chart) will help identify target areas just fine.
It’s worth adding that these targets are not precision points. They should be viewed as areas, so one shouldn’t get hung up on a specific level. If the market’s a little weak, it might not reach all the way to the target, whereas a strong one could go through it (and vice versa for a short).
Practice looking at these high density price levels and see how much it helps show where the market is going.
John Forman, author of The Essentials of Trading, is a 20+ year veteran of trading and analyzing the markets. He is currently an equity market analyst for Thomson Reuters, where he provides intraday commentary and trading recommendations for institutional subscribers, having previously held similar positions in forex and fixed income. John has authored dozens of magazine and website articles on trading and market analysis and provides information and insights on his trading education blog, https://www.theessentialsoftrading.com/Blog