How to Trade Short-Term Reversals in Forex
From my incidental experience of observing other market
participants, I have come to believe that increasingly more sophisticated
technical analysis is nowadays being put to work to serve the industry’s same,
decades-long purpose: comprehending the market in its smallest details and
gestures, and controlling it around-the-clock.
In the way I look and deal in the markets, however, I hold a different approach:
I let the market meet a rigid set of principles and infrequent intuition, rather
than the other way round. My one and only agenda is to speculate, not to
control.
With me, technically speaking, everything starts with the simple act of
observation – that is what I do for most of the time. I have a strong observing
interest for markets (conditions) which get overextended, even becoming
parabolic at times, that fuel an increasingly more severe disequilibrium between
market forces and interests, giving either the bulls or the bears a status of
overstretched confidence.
However, a constant interest for making observations still translates into zero
interest for stepping in betting. It is not until I am spotting an ‘anomalous’
element in the otherwise well-established order of a trend, that I may decide to
bet against that trend. Such ‘anomalous’ element may be a predecessor of a swift
and dramatic change of market direction – particularly in that the supply and
demand could rearrange themselves in a tectonic shift with little or no
interference from ‘external’ triggers (regular economic releases, for just one
example). That is why I regard exploring such extremely peculiar and infrequent
situations as technical analysis in its purest form, since a change in price is
caused mainly or exclusively by the very extreme conditions that have grown
embedded in the price itself.
Consistent with the framework just described and as in my own technical
perception, a ‘2B bottom’ reversal can be considered an ‘anomaly’ insinuating
within the generally accepted, solid establishment of a trend.
On a reference daily chart and in the way I define it myself, the ‘2B bottom’
sort of reversal is produced as a particular chart formation in a market that
had already been extending downwards for a notable period of time. The market
establishes an initial low, then swiftly recovers yet only for a few days, just
to quickly resume falling back down re-engaging into testing that recent low. At
this point, as the bears are getting overconfident themselves and the selling
pressure appears as huge – there comes the day when price marginally penetrates
the market’s recent low, yet again it surprisingly recovers and closes that same
day marginally above that low just tested.
So basically during a rather short period of time the speculator comes to
observe a particular variation of the ‘double-bottom’ classic chart pattern (or
even of the just as popular ‘1-2-3 reversal’) on which at the level of the
second bottom the market ignites an all the more surprising and generally
un-expected bullish attitude. The bout of buying that erupts is so unexpectedly
strong, that I often see the financial media ‘questioning’ it for a significant
period of time in spite of the positive recovery that gradually becomes apparent
on the reference chart.
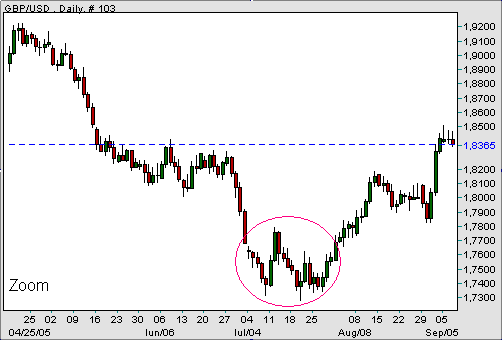
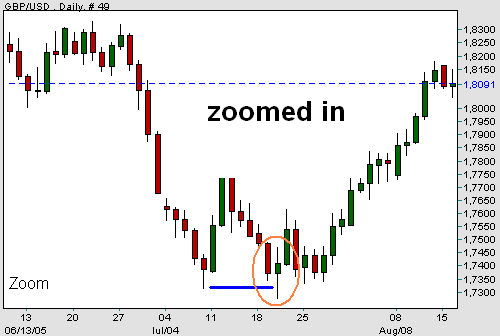
Notable ‘2B bottom’ reversals in spot forex were seen, for only the first of the
notable instances that will be mentioned, in the USD/CAD on May 31st (of this
year), or in the GBP/USD on July 20th of last year (see the following,
zoomed-out and zoomed-in charts of the GBP/USD; copyright: netdania.com).
Another ‘2B bottom’, although not that recent, occurred in the EUR/USD on August
4th, 2004, that was followed by a stunning recovery of the currency pair only 48
hours later. If I remember it well, the setup exploded northwards on August 6th,
also a Friday of US non-farm payrolls release ; the buying spike that took place
during that day’s early US transacting time happened to be so terribly strong,
that price gapped through my already ambitious take-profit order and I had to
face a lot of execution problems with my broker in order to get myself out.
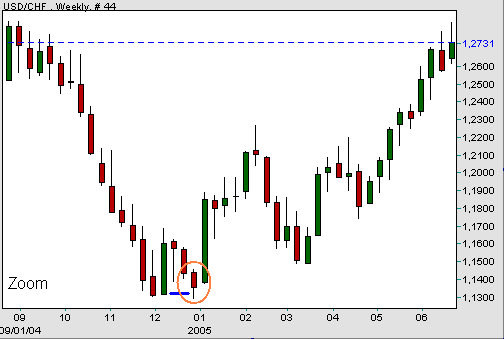
Particularly remarkable and perhaps not only in my own consideration was the ‘2B
bottom’ stamped by the USD/CHF – in the larger, weekly chart timeframe as per
the currency pair’s close of the last week of December 2004 – back at the time
charting a sudden threat to the multi-year strongly established USD bearish
ground.
That ‘anomalous’ technical sign was followed by a one-year long positive
correction of the US Dollar not only against the Swiss Franc, but widely across
the board as well (see the following USD/CHF chart ; copyright: netdania.com).
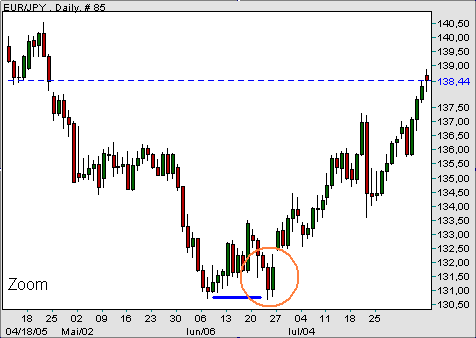
There can be seen also variations of the ‘2B bottom’ where – for one example –
the market does not ignite its swift recovery off the pattern’s second bottom on
the same day that bottom occurs, although it does so very soon in the
afterwards.
An illustration of a ‘2B bottom’ variation could in my view be linked to the
price behavior observed in the EUR/JPY during June of last year (see the
following EUR/JPY chart ; copyright: netdania.com).
To my knowledge, there happens to be very little amount of literature about what
I have described and illustrated above.
Interestingly enough, I made and entered my first ‘2B bottom’ observations and
effective bets during the year 2004 as an intraday player in the USD/CAD market
– and back at that time in my public as well as private communication I was
referring to the setup naming it ‘bear trap’, not knowing that was too a just as
well established ‘terminology’.
The all too often dramatically swift change in the market direction that follows
a ‘2B bottom’ reversal is triggered by a shocking wave of buying that catches an
overextended, ultra confident pack of bears on an awfully wrong footing. As the
bears suddenly start feeling and acting like ‘trapped’, heavy layers of stop
orders placed in the immediate vicinity of the ‘2B bottom”s second bottom
become extremely vulnerable to a surprising and self-reinforcing price recovery.
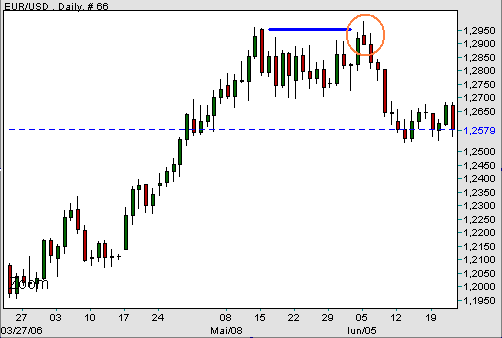
By ‘inverting’ the chart and psychology of the ‘2B bottom’, the so-called ‘2B
top’ reversal is revealed.
One quite recent ‘2B top’ observation could be made only a few weeks ago in the
EUR/USD, on June 5th – upon a widely media commented, failed new test of the
bulls in the immediate vicinity of the round 1.30 level (see the following EUR/USD
chart ; copyright: www.netdania.com).
The ‘2B bottom’ / ‘2B top’ technical appearances are far from being exclusively
linked to foreign exchange dynamics. I have myself been observing these two
particular setups in various, highly liquid futures and stock markets.
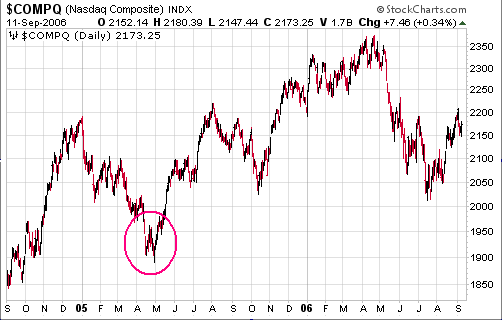
You will find below an illustration of a ‘2B bottom’ reversal displayed in the
spring of last year in one of the major US stock indices (see the following
chart of NASDAQ Composite ; chart courtesy of StockCharts.com).
Just like other technically ‘anomalous’ signs which – at infrequent times – may
enforce me to over-leverage personal bets, the ‘2B bottom’ and ‘2B top’
reversals can be extremely rare appearances. Even when these setups do show up
on the reference charts, the one speculator willing to use them as technical
rationale for constructing counter-trend bets must assume a contrarian attitude
which is not easy to get or maintain.
If I already made a decision to buy based on a ‘2B bottom’ daily chart
appearance and in what I perceive to have grown as an overextended market, I
will take that sort of action right on the day the pattern’s second low is
posted. It is then very likely that I will place a rigid, initial and often very
tight stop-loss order just marginally under the ‘2B bottom” second low.
As usual, I am not to perform any intraday tweaking, nor do I impose myself
having a firm profit target. It is nevertheless true that I may be thinking of
an indicative objective, and as my position matures I would also come to
establish interim, trailed protective orders – but in the same time I am always
mentally prepared to follow up with a reward which may develop
disproportionately higher than the initial risk assumed.
Of course, there can be no guarantee of actually recording any buying or selling
success necessarily associated with the particular kind of observations as above
described.
Mihai Nichisoiu started to trade currencies first in
the local futures market, then in early 2002 moved to dealing in the wide
foreign exchange. Since the beginning of 2004, Mr. Nichisoiu has become mainly
engaged in building a personal long-term track record in the sense of posting
high rates of return only if at the expense of tight and rigid approaches of
risk. Mr. Nichisoiu won the August 2005 edition of a popular global demo trading
contest, after constantly achieving top rankings during an 11-month long
participation. As a currency speculator, Mr. Nichisoiu is also actively involved
in managing and providing counseling and advisory to a small number of long-term
private connections.
Mihai Nichisoiu can be contacted via his recently established, personal website
www.mihainichisoiu.com.
