Market Trading with Symmetry
From 1990 to 1997, Kevin Haggerty served as Senior Vice President for Equity Trading at Fidelity Capital Markets, Boston, a division of Fidelity Investments. He was responsible for all U.S. institutional Listed, OTC and Option trading in addition to all major Exchange Floor Executions. For a free trial to Kevin’s Daily Trading Report, please click here.
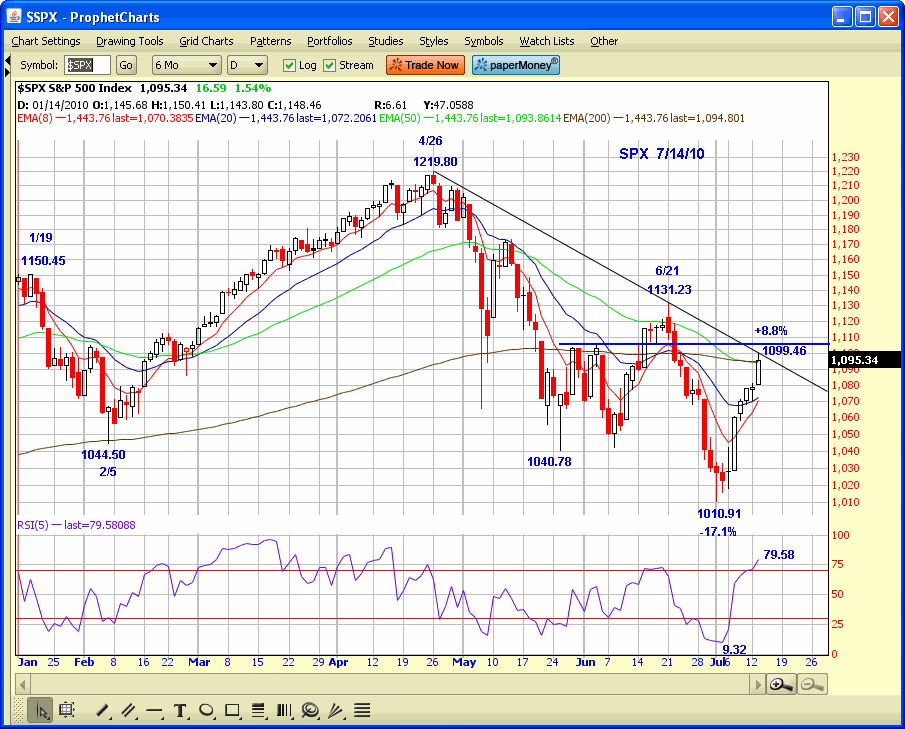
The SPX is +8.8% in 7 days from the 1010.91 low and .382RT to 667 from 1576. It is now ST-O/B with the 4DMA of the volume ratio 78, and breadth ratio 70. The 5RSI is 79.58 versus the extremely O/S condition at 9.32 when the SPX made the 1010.91 low. Also, the SPX has advanced 6 straight days in this “V” bounce making higher highs and lows so odds obviously favor the pullback, but the best case would be a consolidation at the 200DEMA to work off the ST-O/B condition and then a move higher which would force the Generals and hedge funds to play in the game.
In the previous commentary [Market Probability for Short Term Reversal] I posted the actual commentary from my Trading Service which outlined all of the symmetry that made the 1010.91 low a very high probability reversal zone and that is how I approach every market position trade so I suggest you read it, if you haven’t already done so.
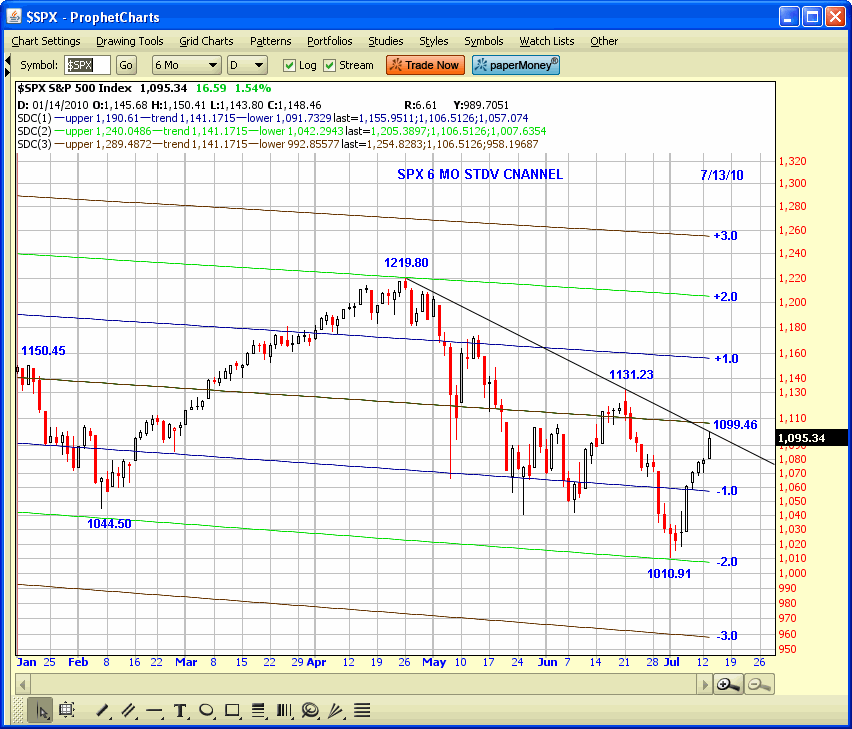
The SPX closed yesterday at 1095.34 which just above the 1094.80 200DEMA, in addition to being right at the down trend line from the 4/26 1219.80 high. The index has traded to Fib symmetry all year and today is day 8 of the bounce off the 1010.91 low and trading day 55 from the 4/26 1219.80 high. If you bought the high probability 1010.91 reversal zone good for you, but if you didn’t, this is obviously not the time to play catch up because the odds are stacked against you, which is obvious in the first paragraph.
This is an option expiration week, and there is usually at least one +/- 1.0% move in either direction, and then again the following week. The SPX was +1.5% yesterday and there was probably some option expiration activity, but the primary reason was that the “risk trade” was on.
The XEU continued to advance on significant short covering and was +1.0% yesterday to close at a 127.20, which is a new rally high, while the USD was -0.8 to 83.64 which is a new low in the 26 day decline from the 88.71 high with the 200DEMA at 81.93. The TLT also declined [-0.9%] while the commodity sectors and crude oil advanced. Don’t mistake a rising Euro for a change in the sovereign debt status and don’t believe the political hype about the bank stress tests [fraud] because they have major problems and are not lending to each other, nor are the U.S. banks lending to Europe, not to mention the severe cutback in U.S. bank lending to small business and consumers in the once good old USA.
The main stream media is nothing more than a shill for the current administration, and outlets like CNBC have a mandate to put the best possible spin on the economic news so don’t get emotional and buy the phony earnings season hype.


Have a good trading day!
Click here to find full details on Kevin’s courses including Trading with the Generals with over 20 hours of professional market strategies. And for a free trial to Kevin’s daily trading service, click here.
