Moving Averages: ETF Strategies for Short Term Traders
What are the two most important moving averages for short-term, high probability ETF traders?
Moving averages are a very popular tool, and are a key ingredient in many trading strategies. Moving averages are typically trend-following tools that help traders determine what kind of trend, if any, a given market has developed.
One problem with moving averages is that many of the uses of moving averages have not been quantified – especially for short-term traders in stocks and ETFs. As a result, a number of short-term trading strategies for stock and ETFs that rely on moving averages or even multiple moving averages, have often underperformed.
If you are looking to trade one of the most powerful pullbacks strategies available to traders today, order our newly updated guidebook –The Long Pullbacks Strategy– by by clicking here today.
Our research into short-term price behavior – in both stocks and ETFs – has found two key roles for moving averages in our trading strategies. These roles enable us to use moving averages for what they are best equipped to do – at least from the perspective of a short-term, high probability trade designed to last 5-7 days. Here, we will take a look at those two roles and which two moving averages have been quantified to fit the bill.
Only Buy Above the 200-Day Moving Average
The most important moving average in our research, the one that is most important to our high probability ETF trading strategies, is the 200-day moving average. While we have developed a few trading strategies that are “moving average agnostic,” the vast majority of our high probability trading strategies call for buying above the 200-day moving average.

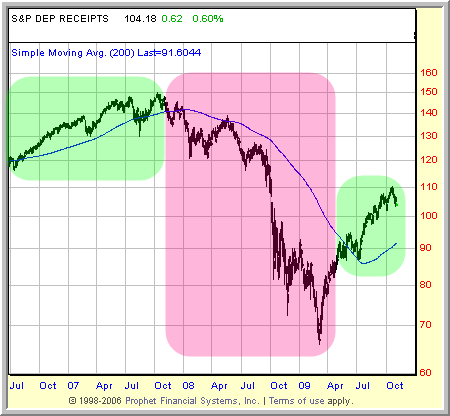
The green highlighted sections show when the ^SPY^ was trading above its 200-day moving average. The red highlighted section shows when the SPY was trading below its 200-day moving average.
If you examine a large set of data, you will notice that markets that are above the 200-day moving average tend to recover after short-term pullbacks. At the same time, you will also notice that markets that are trading below the 200-day moving average tend to resume their downtrends after temporary bounces.
This tendency has been uncovered time and time again in our testing of both stocks and exchange-traded funds (ETFs). And while there have been few, specific exceptions, our backtesting confirms that for the vast majority of the time and for the vast majority of traders, the 200-day moving average is a critical technical indicator to help traders do the right thing on the right side of the market.
The 5-Day Moving Average Exit
The other moving average that has withstood our testing (testing which has included thousands of stocks since the early 1990s and hundreds of exchange-traded funds since inception) is the 5-day moving average.
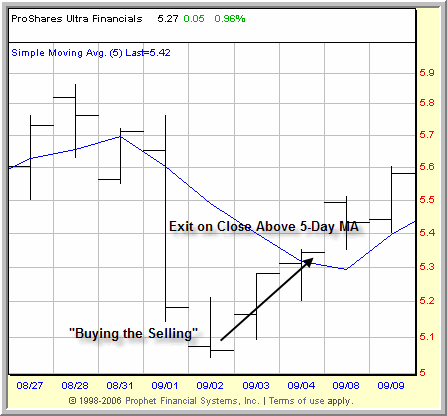
What do we use the 5-day moving average for? Our testing has shown that for short-term trading strategies that are based on buying after pullbacks (“buying the selling”) exiting the trade after the market closes above its 5-day moving average is a simple and effective trading strategy for exiting high probability trades (“selling the buying”).

Exiting trades after they close above their 5-day moving average is one excellent and quantified strategy to “sell the buying” and take profits from high probability trades like this one in the ^UYG^.
A close above the 5-day moving average is a sign that the market is gaining strength. Remember that the 5-day moving average takes the average of the five most recent closing prices of the market. When a market closes above the average of its recent closes, it is a quantified show of strength that high probability traders can rely on when looking for the requisite “strength” into which to exit high probability trades.
One last note: when we use moving averages in our testing and our trading strategies, we use the simple moving average rather than any of the more exotic varieties. We have found that we gain no significant edge in our testing by substituting more complex moving averages when basic, easy-to-calculate moving averages like the simple moving average is available.
Did you know that our PowerRatings work for exchange-traded funds too? If you’ve been looking for help in trading ETFs in both bull and bear markets, then our ETF PowerRatings may provide the solution you are looking for. Click here to start your free trial today!
David Penn is Editor in Chief at TradingMarkets.com.
