Simplifying the Yield Curve & 3 Top PowerRatings Stocks
The financial news is full of stories on the yield curve, treasury rates and their effect on the stock market. What exactly is the yield curve and why should stock traders care?
As in most things finance related, the yield curve concept sounds way more complicated than it actually is. Simply put, the yield curve is a graphic representation of the yield on bonds across different maturity dates.
Generally, the longer the maturity, the greater the yield or return. This makes perfect sense giving the fact the longer one holds an investment, the greater the risk therefore the greater reward required. You will hear economists describing the yield curve in one of four ways and each way can be reflected in the economy itself. It is flat, normal, steep or inverted.
Flat is the word used when there is little difference between the long and short term. If you are an avid stock trader, you know that when a stock slim jims or flat lines it usually isn’t for long and is potentially signaling a change. It’s the same thing for a flat yield curve.
The normal curve looks like an upward drift on the chart. This indicates an economy normally functioning without fear of inflation or any abrupt change. It is similar to a slow grinding uptrend on a stock chart, solid looking but not very exciting.
The yield curve is described as steep when the longer term possesses much higher yields than the short term. This steepness would be described as a parabolic move on the chart by stock traders. It is a sign of inflationary fears. A yield curve described as steep generally signals rising increase rates will soon be happening.
Finally, an inverted yield curve is downward sloping. This describes long term yields being similar to or less than long term yields. An inverted curve signals falling interest rates. It is important to keep in mind that, just like stock prices, the yield curve isn’t a smooth line. It moves erratically but you can observe one of these four characteristics on the chart.
Monday, the 10 year Treasury yield stretched over the 4% level but fell back to 3.98%. However, stocks appear to have ignored this signal of potential pending interest rate hikes so far. Time will tell if the increase will lead to higher rates and the start of a downward sloping stock market.
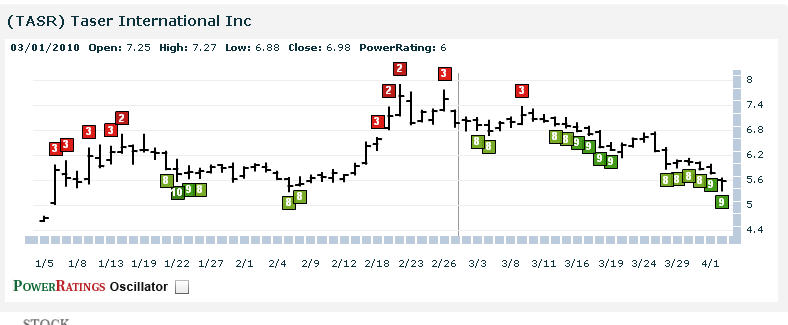
Here are 3 top PowerRatings stocks that are ready for a short term pop higher:
^ZOOM^
^SOMX^
^TASR^

Learn more strategies for trading stocks in the short term with a free trial to our PowerRatings! The highest rated stocks have outperformed the average stock by a margin of more than 14.7 to 1 after five days! Click here to launch your free PowerRatings trial today!
David Goodboy is Vice President of Business Development for a New York City based multi-strategy fund.
