The RSI Files: 3 PowerRatings Stocks Pushing the Extreme
Most traders and short term investors are familiar with the Relative Strength Index or RSI. It is an oscillating indicator first popularized by Welles Wilder in his 1978 book, New Concepts in Technical Trading Systems. It is used to locate stocks that are overbought or oversold by comparing increasing price moves to decreasing price moves over a specific time frame.
RSI is built into many trading/charting platforms with the Welles Wilder standard setting of 14 periods as the default. It is scaled on a chart from 0 to 100. Readings below 30 are believed to indicate an oversold condition; those above 70 are thought to indicate an overbought condition. Â
 In our quest to find out how markets really work, it was decided to put the RSI to the test. Using a data base of over 8 million trades since 1995, it was clearly shown that the 14-period RSI held no statistical edge whatsoever in forecasting short term price changes. Wait a minute! Literally 1000’s of traders relay and trust this indicator for their short term trading needs. Well, it just goes to show that many traders follow what they have been told without making sure it passes proper testing.
Prior to throwing out the entire concept of RSI, it was decided to test it with different periods. We were quite surprised and delighted with the results. If the RSI periods are reduced to 2, a statistical edge existed. The testing was done by building a benchmark of the average percentage gain/loss of all stocks, trading above their 200-day Simple Moving Average, over a 1 day, 2 day, and 1 week timeframe. What was statistically proven was that the lower the 2-period RSI, the better the performance against the benchmark. In addition, the opposite also proved to be true. The higher RSI(2), the higher the underperformance against the benchmark.
How can this information be put to practical use to help your short term investing? Simply put, only look at stocks with an RSI(2) of 2 or less for short term longs. If you are seeking companies to short, apply the opposite logic by only considering shares with an RSI(2) reading of 98 or above.
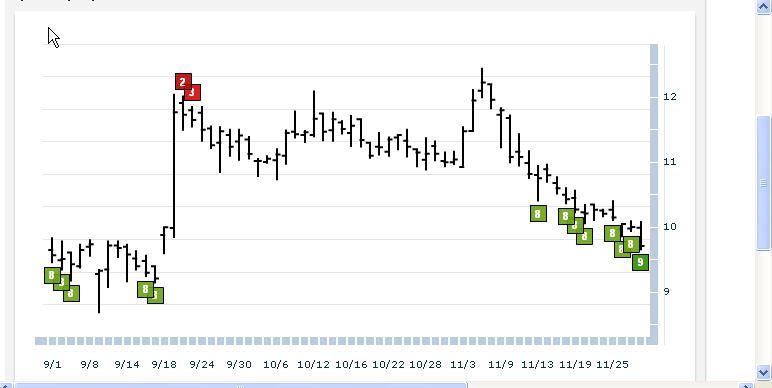
Here are 3 PowerRatings stocks with RSI(2) less than 2 for your consideration:
Syneron Medical
(
ELOS |
Quote |
Chart |
News |
PowerRating) – Â RSI(2) 0.54, PowerRatings 8

SonoSite
(
SONO |
Quote |
Chart |
News |
PowerRating) – RSI(2) 0.22, PowerRatings 9
Conexant Systems
(
CNXT |
Quote |
Chart |
News |
PowerRating) – RSI(2) 1.70, PowerRatings 8
Learn more strategies for trading stocks in the short term with a free trial to our PowerRatings! The highest rated stocks have outperformed the average stock by a margin of more than 14.7 to 1 after five days! Click here to launch your free PowerRatings trial today!
David Goodboy is Vice President of Business Development for a New York City based multi-strategy fund.
