This Is Why You Should Look For Inside Bars
Centex Corp (CTX) bounced off the
upper Bollinger band and closed near the day’s low yesterday as you
can see below. Notice the MACD histogram is showing a negative divergence.

09:55:13 (from TradersWire)
![]()
|
Action |
Symbol |
Order Type |
Setup |
Stop |
 Target |
Current Price |
Posted By |
|
Sell |
CTX | sell stop at 71.28 | Nearing yesterday’s high | 71.51 | 71 | 71.33 |
TK |
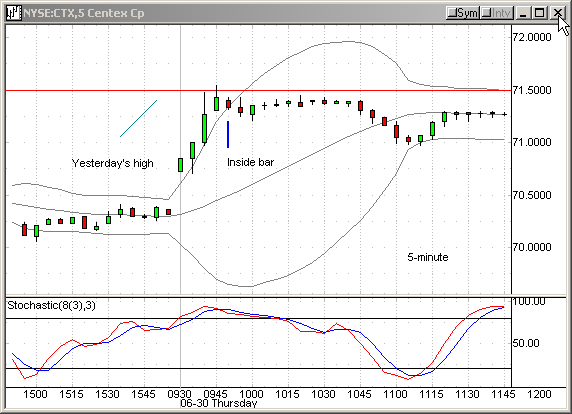
Let’s see the 5-minute chart from
this morning. The issue opened with a gap and began to rally toward yesterday’s
high. This movement was occurring above the upper Bollinger band. This kind of
momentum cannot last long time. Shortly before 10:00 A.M., CTX formed an inside
bar. This was a potential reversal situation. I placed a sell stop at 71.28.
11:03:36
Follow up on CTX (Pt 2)
It has hit our target. Cover your shares, or re-adjust your stop.
Good luck with your afternoon trading!
T.KÂ