This Is Why You Should Pay Attention To Inside Bars
Amazon.com (AMZN)
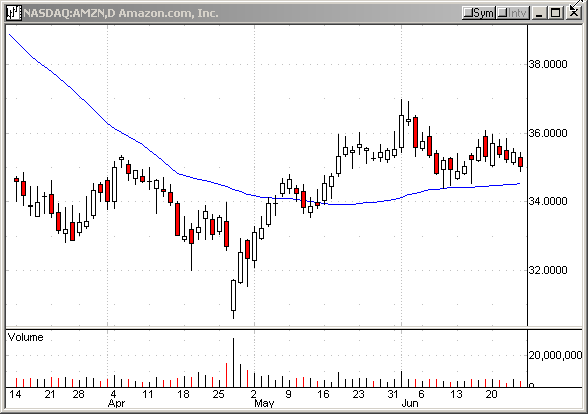
closed near the day’s low last Friday, and it looked ready to test
the 50-day SMA.

10:49:15 (from TradersWire) The clock is three minutes fast.
![]()
|
Action |
Symbol |
Order Type |
Setup |
Stop |
 Target |
Current Price |
Posted By |
|
Sell |
AMZN | sell stop at 34.74 | pullback | 34.91 | 34.55 | 34.79 |
TK |
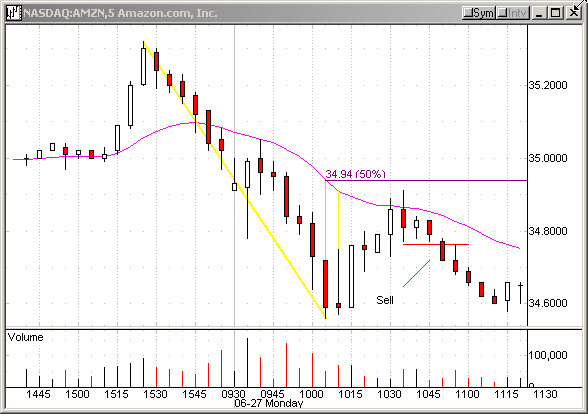
Now, let’s look at the 5-minute
chart from this morning. AMZN hit the intraday low shortly after 10 o’clock and
began to pull back. The issue briefly traded above the 20-period EMA, but never
succeeded to take out the 50% retracement level. The 10:40 bar was an inside
bar. This could be a potential reversal situation. I placed a sell stop at
34.74.
11:12:47
Follow up on AMZN (Pt 2)
Cover half to take a 11-cent gain. Keep stop at breakeven.
11:23:52
Follow up on AMZN (Pt 3)
We are covering the rest. The issue may be forming a double bottom (5-min).

Feel free to mail me your
questions.
Â
