USD Versus Trivia through Year-End
From 1990 to 1997, Kevin Haggerty served as Senior Vice President for Equity Trading at Fidelity Capital Markets, Boston, a division of Fidelity Investments. He was responsible for all U.S. institutional Listed, OTC and Option trading in addition to all major Exchange Floor Executions. For a free trial to Kevin’s Daily Trading Report, please click here.
Commentary for 12/19/21
In the previous commentary for 12/7/11 I noted the SPX had advanced +9.3% in 6 days from the 1158 .618RT to 1074.77 from 1292.66 to the 1266.73 high on 12/5, and was S/T-O/B in the resistance zone. It made a 1267.06 intraday high on 12/7 and declined to a 1209.47 low, or -4.6% on 12/14, closing at 1211.82.
The SPX closed the week -2.8% to 1219.66 on triple witch, but Trading Service members took advantage of the vertical “funny money” opening Fri as the SPX went vertical from the 12/15 1215.76 close to the 1231.04 intraday high on the 10:20AM reversal bar. Most members faded that level because 1230.71 was the 8/31/1 range high, and the +1.0 VB Fri was 1230.30, so there was excellent symmetry to make the day trade at extended symmetry that always makes for higher probability trades. The short entry below 1229.53 on the 10:25AM traded down to 1215.16 on the 12:45PM bar before trading sideways in a 4.6 point range into the 1219.55 close [12/16].
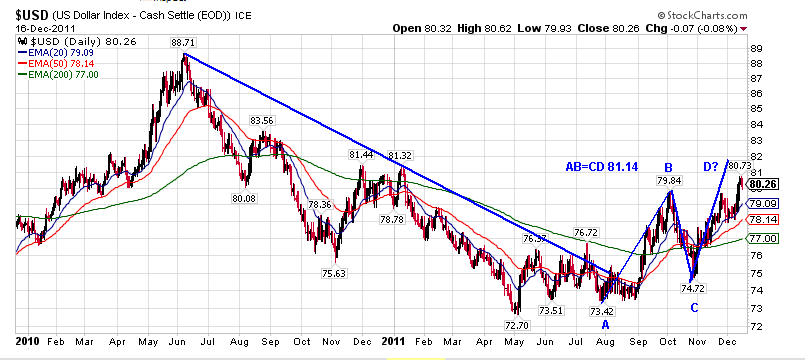
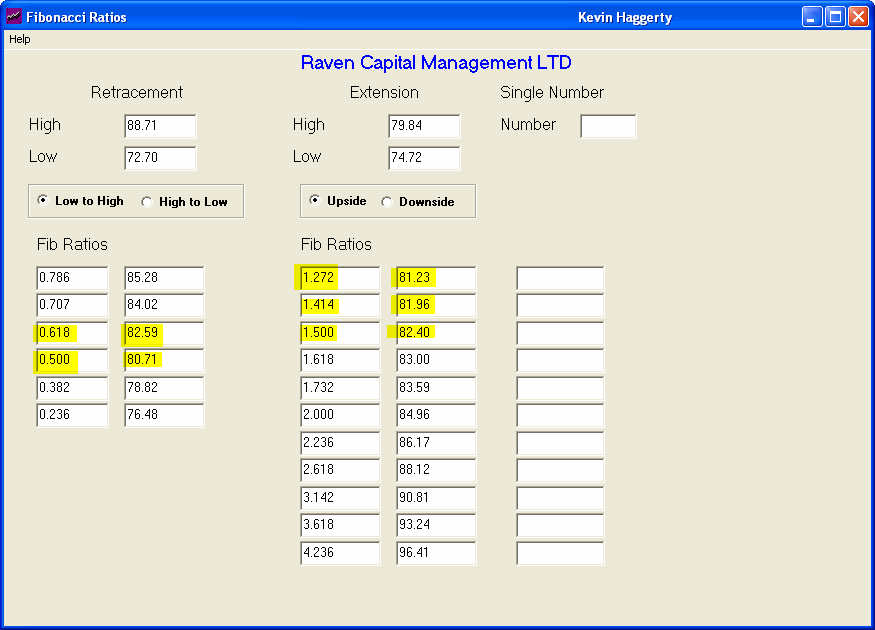
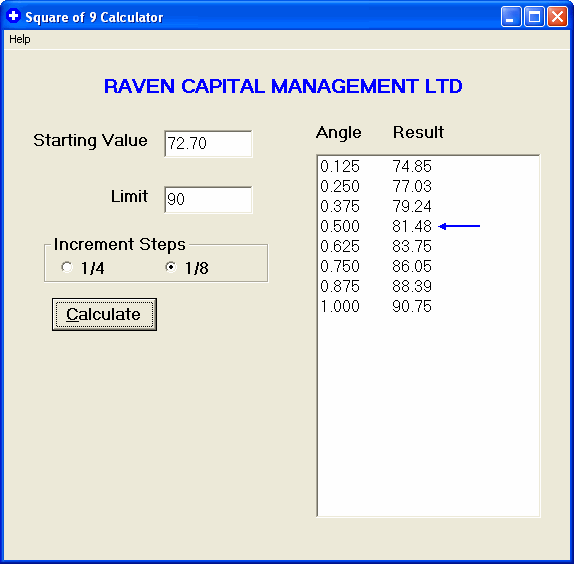
The USD is making new highs and was +1.6% last week to 80.26 after an 80.73 high on a 123 trend B/O, and looks like it will trade higher which will put more pressure on commodities, which are already S/T-O/S, and be a head wind for the equity markets. The .50RT to the June 2010 88.71 high from the 72.70 May 2011 low is 80.71, and the .618RT at 82.59 which is likely if it can take out and close above 80.71 There is also 90 DEG [Gann] angle symmetry at 81.48, and Fib extension symmetry of the last leg down from 79.82 to 72.72 at 81.23, 81.96, and 82.40 [see calculator charts].
Europe is ugly, and there are no silver bullets by taking the current IMF austerity package as their economies will sink even more, in addition to the fact that most of their banks are insolvent if they had to mark to the market like our banks do, or at least we are told they do. The region is totally unstable, especially with Italian debt at 120% of GDP and its economy sinking even more into insolvency if they have to keep paying 6-7% for debt while their GDP shrinks 4-5%, so the math does not add up. I wouldn`t invest a nickel in Europe other than maybe short term German paper if you had to do something in Euro`s.
The SPX is below its 200DMA`s at 1233.84 [EMA] and 1260.25 [SMA] in addition to the H&S neckline that runs through 1275. The only near term minor support is the trendline from 1074.77 through 1158.66, but don`t go to the bank on that.
Today is Fib day count 8 from the 12/7/11 1267.06 high, while 12/21 is 55 days from the 10/4/11 1074.77 low, and 12/22 is 135 days [multiples of 45 Deg days] from the 8/9/11 1101.54 low, so we are in a Fibonacci cluster period the next few days. The trivia is that the next 2 weeks into year end are among the strongest seasonal of the year have been up better that 70% of the time during the 3rd year of an election cycle. However, the market is not at a key price and time zone confirmed by any technical O/S or O/B evidence, so what the market actually does into year end is just Trivia speculation, which is no problem for day traders that go out flat every night.


Click here to find full details on Kevin’s courses including Trading with the Generals with over 20 hours of professional market strategies. And for a free trial to Kevin’s daily trading service, click here.
