Using Direction to Fine Tune Your Indicators
Do you have your RSI and Stochastics thresholds set at 70/30 or 80/20? Do you have your Keltner ATR Bands set at equal distances on either side of the moving average in the center? If so you can easily improve the accuracy of your indicators by adjusting them to reflect the direction of the market.
Before we show our examples let’s make sure that the logic of adjusting the indicators for direction is clear. If we use the default thresholds of 70 and 30 for RSI we are requiring equal moves in either direction to identify “overbought” and “oversold” conditions. These default settings would be correct in a sideways market. But what if the market has a direction? If the direction of the trend is up we can assume that the excursions to the downside will not be as great or as often as the excursions to the upside.
Click here to learn exactly how you can maximize your returns with our new 2-Period RSI Stock Strategy Guidebook. Included are dozens of high-performing, fully quantified stocks strategy variations based around the 2-period RSI.
Now if the trend is up we would want to favor buying dips using our RSI thresholds. However because the trend is up we are much less likely to reach the lower default setting which we would expect to be accurate only in sideways conditions. In a rising market we need to raise our lower threshold to make it easier for us to find buy signals. Instead of using the default thresholds of 70/30 we would want to change the thresholds to 70/40 to make it easier to find entry signals that favor the direction of the trend.
Let’s look at a recent chart of Google
(
GOOG |
Quote |
Chart |
News |
PowerRating).

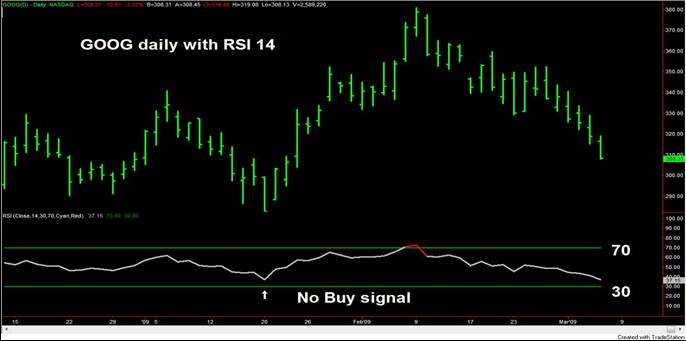
With the default settings at 70 and 30 we fail to get an entry signal after the RSI low about January 20th.
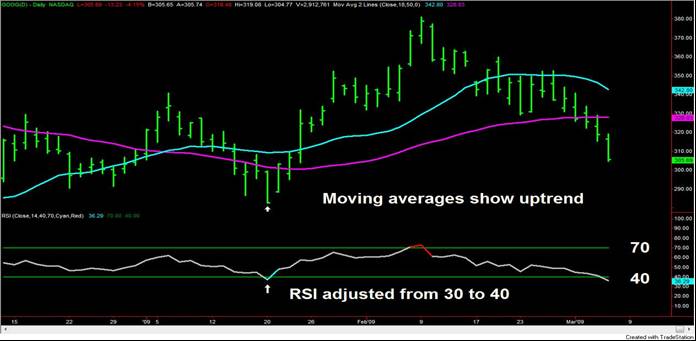
Now let’s see what happens when we adjust the RSI thresholds according to direction. We will use a fast and a slow moving average to show the direction.

As we can see on the chart we now have a clear oversold entry signal on our 14-period RSI indicator that did not show up using the symmetrical default settings of 70 and 30.
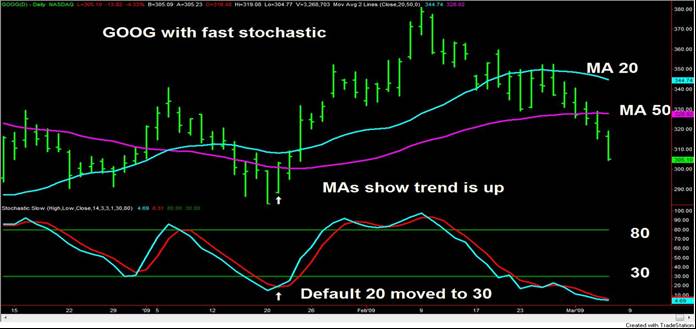
Now let’s examine the GOOG chart using a fast stochastic to indicate overbought and oversold levels.

Closely examining the Google chart with the stochastic indicator allows us to discuss an important point. Does moving the thresholds according to direction do any harm? As far as I can tell it doesn’t hurt. In the chart above we would have had an entry signal with the standard 80/20 thresholds because we dipped below 20. But we still got the same entry signal with the threshold at 30 so what’s the harm? Under many conditions the adjusted threshold will generate profitable entries that the default settings will miss. On the other hand the adjusted thresholds will never miss signals that get down to the unadjusted threshold. Unless you are concerned about generating false buy signals in an uptrend (not likely), adjusting the indicators can only improve performance.
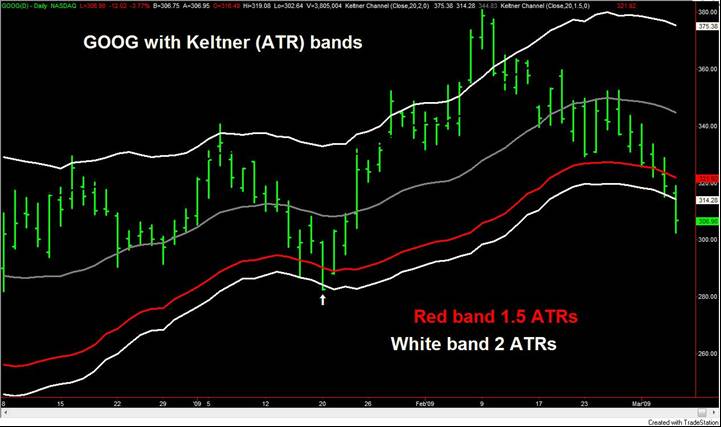
Another indicator that I am fond of using for entries is the Keltner band strategy that places bands a number of ATRs (average true ranges) either side of a moving average.

In the chart above we can see that the wider band (2 ATRs) just barely caught the buy signal. If we had adjusted the band to 1.5 ATRs the penetration would have been much more obvious and it would have done no harm to use the tighter channel.
It seems obvious that we can benefit from adjusting the indicators for direction so that we can have more trades entered in the direction of the trend. But each of these indicators has two variable inputs. For example when we adjust the RSI from the default of 70/30 to 70/40 in a rising market, shouldn’t we adjust both thresholds upward to 80/40?
Not necessarily. The logic is to make the entry signals easier and therefore more frequent in the direction of the trend. The other side of the threshold is not part of that process unless we are going to use it to reverse directions and trade against the prevailing direction. That’s a risky strategy that I would not recommend. It is directly counter to our logic in adjusting the indicator to make it easier to enter in the direction of the trend. Adjusting the upper threshold farther away would only slightly lessen the likelihood of generating trades against the trend. In a strong uptrend we would expect to see many penetrations of the upper threshold even if we adjust it. The problem we are trying to solve with our adjustments is to make it easier to generate more entries in the correct direction.
However, moving the upper threshold farther up might help if it is going to be used as an aid to profit taking because it would tend to provide slightly larger profits than a lower threshold. The choice of what to do with the non-entry side of the threshold will depend on what you intend to do when it is penetrated. If you have confidence in the direction of the trend you would ignore entries in the opposite direction.
The logic of adjusting entries to favor a particular direction can be applied to many trading strategies. Let’s take the famous Turtle 20-day breakout strategy for example. In a prevailing uptrend a 10 or 15 day breakout would work better than 20. If you were trying to buy in a prevailing downtrend (like the current stock market) you would be better off waiting for a 30 or 40 day breakout. Take a look at your favorite indicators and think about how you can fine tune them to favor the primary direction of the market.
Charles LeBeau is the co-author of Computer Analysis of the Futures Market and his educational website can be found at www.TraderClub.com. He has been trading with technical indicators for more than 40 years. He is currently Director of Analytics for www.SmartStops.net.
