Using Range Days as a Trend Indicator
One of the better minor trend change indicators that bar charts provide are referred to as “Range Days”. When they do occur, these price pattern indicators are helpful to the chartist in gauging what may happen with the near term price action – more specifically – the next trading day. Range Days might have more significant value to the price pattern that may last more than a day, but it is far better to utilize such patterns for their expected one day forecast only.
Click here to order your copy of The VXX Trend Following Strategy today and be one of the very first traders to utilize these unique strategies. This guidebook will make you a better, more powerful trader.
The technical expectation of a range day is that an opposite close than that of the previous days bar is to be expected the next trading day. For example, if the price pattern bar closes down on Tuesday, and a range day is provided on Wednesday, the forecasted expectation would be for an up close on Thursday. It’s important to note that this group of indicators only suggests the direction of the closing price and not to the percentage change of this same settlement.
There are four descriptive range day classifications:
Inside Range Day: This is when the entire day’s price activity is contained within the previous day’s price range. In an uptrend, this type of pattern appears when the bulls, who have had trending control of the market’s price pattern, were not able to push prices in this same direction during the trading day. At the same time, the bears were not able to gather enough strength to reverse prices below the prior day’s lows. In other words, the two forces were in balance between buyers and sellers, with the likelihood that a near term momentum shift would be expected the next day to fulfill the patterns expectation. This same principle also applies in downtrends as it does in uptrends.
Outside Range Day: This is when the entire day’s price activity makes a lower low and higher high than that of the previous day’s trading session. As with the Inside Range Day, trading days like this occur when supply and demand forces are becoming more balanced and that the prevailing trend might be temporarily interrupted because of this.
Mid Range Close: This is when prices close approximately between the highs and the lows of the trading day’s range. This type of day occurs when traders didn’t really know where to close prices from the previous day’s settlement, and where the forces of the prevailing trend have lost their dominance. Of all of the range days reviewed, the Mid Range Close has the highest probability of next day forecasting ability.
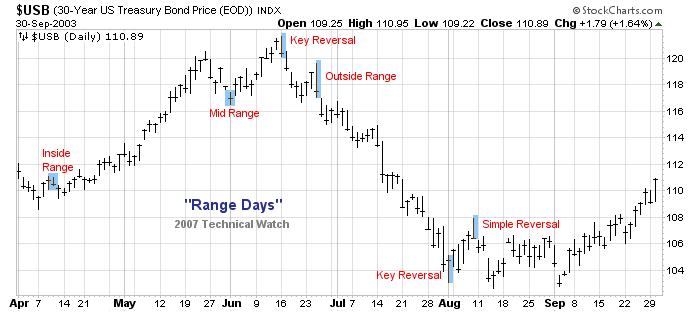
The Key Reversal: With its birth coming from the futures market, the “Key Reversal” pattern is probably the best known but least understood reversal bar. Many traders come to the erroneous conclusion that this bar pattern marks the end of the existing trending price move. As with the other three reversal patterns already mentioned, the Key Reversal might extend to more than just a single trading day change in the prevailing price trend, but in no way is this the strict technical expectation within this family of indicators.
Unlike the previous three range days mentioned, there are very specific qualifications that separate this price bar from being that of a simple reversal bar and that of being one of “key” to the existing price trend sequence.
These differences include:
1) Since the “Key Reversal” is a futures market related indicator, the most important characteristic of such a pattern is that in a rising price trend that a “life of contract” high must be made with a lower close than that of the previous day’s session. And, at the same time, a Key Reversal Low would see a “life of contract” low with a higher close. This important component of this range day, the “life of contract” extreme, is what separates it from being one of “Key” than that of being a simple reversal pattern of trend. It’s also important to understand that a Key Reversal need not be an “Outside Range Day”, only that it needs to close lower than the previous trading day’s settlement price to qualify as such.
2) Since the average range of the prior price bars tend to expand during such occurrences, higher than average volume will accompany Key Reversal bars. So if trading volume is average or low, this would suggest that a simple price reversal of trend is occurring and it’s not to be classified as being as a “key” point to the overall price structure.
3) Like simple reversal patterns, Key Reversals take place because those who have been on the wrong side of the market are finally giving up. This situation of closing positions and moving to the sidelines results in declining open interest for the contract being traded. So if open interest expands during such a range day, it’s more than likely not a “Key Reversal” but one of a simple pause in the prevailing trend.
Because of the components outlined above, a “Key Reversal” happens quite rarely, and the importance of such a pattern increases the likelihood of an important price high (or low) if this same reversal pattern happens in more than one time period sequence.
Some final notes on Range Days:
Opening gaps have no bearing on the days eventual trading range or settlement price that would make the pattern viable.
These patterns work their best magic with respect to daily time charts. However, when they do appear on weekly or monthly time scales, the technical expectation of the forecast should be treated as if it were on a daily time frame – that is – for the following week or month only.
And finally, it’s important to keep in mind that the predictive value of these minor trend change indicators work best when you have at least a series of three previous days of higher lows (uptrend) or lower highs (downtrend) to work with as far as discerning the prevailing direction of the short term trend. Creation of these range bars in choppy periods, therefore, do not have the merit of predictability that trending price sequences have, so one does need to take great care not only in pattern recognition, but also for the ingredients necessary for a higher percentage chance of trading success.
Dave Breslaw is a self taught technical analyst who has been involved with market trading since 1973. He specializes in classical bar charting techniques with special emphasis on breadth and volume assessment and its compliment to Elliott Wave analysis. Dave is also the owner of Technical Watch.com and provides weekly reviews of equity money flow components that assists in providing the likely direction of the four major asset classes – gold, commodities, debt, and equities.
Just released! Leveraged ETF PowerRatings ranks Leveraged ETFs on a high probability 1-10 ratings scale. Click here to get your free trial now.