VIXing Profits & 3 PowerRatings Stocks
The Volatility Index or VIX is becoming more and more popular in the financial press. Traders and stock market pundits have a wide variety of opinions on the value of this measured Index.
Everything from the recent article by Laszlo Birinyi (read article here) stating there is no value to the VIX to entire trading firms built upon concepts on the VIX. Some traders call the VIX “The S&P 500 upside down” meaning it moves the opposite way of the S&P 500.
In an effort to determine the truth about the VIX and its relation to stock prices, we conducted several quantitative tests. The results were quite revealing. It was discovered that, when used properly, there is great value in the VIX. First, let’s define the VIX then talk more about how you can start VIXing profits!
The Volatility Index or VIX was first put into practice in 1993. It is built upon a paper written by Professor Robert Whaley. The index measures the implied volatility of the S&P 500 over the next 30 days.
Specifically, it is a weighted blend of prices for a range of options on the S&P 500. These options are priced based on the expected volatility or price changes over the next 30 days. In mathematical terms, the VIX is the square root of the par variance swap rate for the next 30 days.
I know that’s a mouthful, but an easy and useable way to think of it is the number represents the expected percentage move of the S&P 500 over the next 30 days on an annualized basis. This figure has been as low as 9% and as high as 89% since the VIX was started.
When markets drop the VIX usually climbs indicating fear represented by option prices. Climbing markets generally result in a lowering VIX as fear leaves the market and greed starts to take over. In fact, extreme VIX readings like witnessed in October, 2008, correspond with sharp sell offs.
Now that the VIX has been defined, how can you apply this knowledge to help your trading? Our primary discovery is that the VIX is not a static gauge. It needs to be viewed dynamically and not as a static indicator, as most mistakenly do.
One very effective system we discovered is known as VIX Stretches. The premise is the longer the VIX stays above its 10-period Moving Average, and the more stretched it is above this average, the greater the odds of a market rally. We further quantified this concept by breaking it into a 3 step process to properly test the results. Here is how we did it.
- The SPY is trading above its 200-day SMA
- The VIX is stretched 5% higher than its 10-day SMA for 3 or more days. If so, buy the market on the close.
- The trade is closed when the SPY closes above a RSI(2) reading of 65 or more
The results were impressive with 84.85 % of the 33 trades taken being profitable with an average of 363.90 SPX points earned. The average hold time was 5 days.
As you can see, the VIX is a powerful tool when properly used.
Further information on using the VIX to help you make short term investment decisions can be found in Larry Connors’ seminal book, Short Term Trading Strategies That Work.
Here are 3 top ranked PowerRatings stocks:
^CKR^
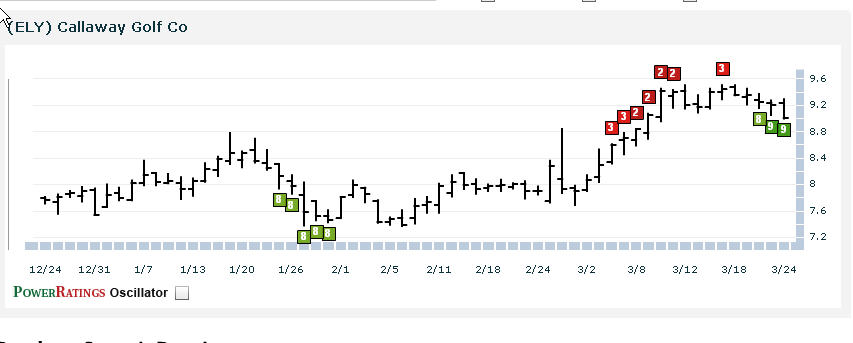
^ELY^

^TESO^
Learn more strategies for trading stocks in the short term with a free trial to our PowerRatings! The highest rated stocks have outperformed the average stock by a margin of more than 14.7 to 1 after five days! Click here to launch your free PowerRatings trial today!
David Goodboy is Vice President of Business Development for a New York City based multi-strategy fund.
