Start Today With This Frame Of Reference
What Monday’s Action Tells
You
The major indices gapped up again with the
SPX
(
$SPX.X |
Quote |
Chart |
News |
PowerRating) hitting 1140.19 at 10:00 a.m. ET, then went sideways again
in a
4 point range. For the past two days, most of the price gain has been on the
gap
openings and early trading with heavy program buying (more so on Friday) and
then the narrow-range Slim Jims into the close. It is easier for the
Generals to
use programs putting new-quarter money to work, in addition to any
reallocation
of sectors, etc.
The market action drifted down into the close
from the day-long Slim Jims following the gap opening period. The SPX
finished
at 1135.17, +0.3%, hitting an intraday high of 1140.19 vs. the 1141 .786
retracement to 1163 from 1061.
The Dow
(
$INDU |
Quote |
Chart |
News |
PowerRating) traded to 10,270 vs.
its
200-day SMA of 10,298, then faded to a +0.2% close at 10,217. The Nasdaq
(
$COMPQ |
Quote |
Chart |
News |
PowerRating) closed at 1952 and ran into some 200-day SMA resistance at
1964,
hitting an intraday high of 1966. The
(
QQQ |
Quote |
Chart |
News |
PowerRating)s reversed off a 36.62 high,
closing +0.6% at 36.31.
NYSE volume dropped slightly to 1.53 billion
shares, but the volume ratio was 67 and breadth +593. The 4 MA of the volume
ratio remains at 69 with the 5 RSI now at 77.
There was a significant drop in
(
SPY |
Quote |
Chart |
News |
PowerRating)
volume
to 33 million from Friday’s first-day-of-the-quarter 63 million. The QQQs
traded
a bit more than average to 108 million. The
(
SMH |
Quote |
Chart |
News |
PowerRating) volume was right on
its
average as it finished +0.7%, but had been +2.6% during the morning rush.
The
RTH and CYC finished green, while the banks, brokers and
(
OIH |
Quote |
Chart |
News |
PowerRating) closed
small
red.
For Active
Traders
If you trade the S&P futures or SPY,
there was a
Trap Door setup after the 10:00 a.m. bar with the SPY making a 114.44 intraday
high while the SPX made its 1140.19 intraday high. 114.50 is the SPY six-month +2.0 standard
deviation level, while 1140.17 was the SPX 1.28 volatility band yesterday and
1141
the .786 retracement to 1163 from 1061. This was all good sequence to take
the
Trap Door by either fading the 114.35 – 114.44 level or below the signal-bar
low
of 114.24. The SPY eventually traded down to 113.81, closing at 113.84, but
the
Slim Jim was so stretched that you probably got timed out with a small
profit or
even scratched.
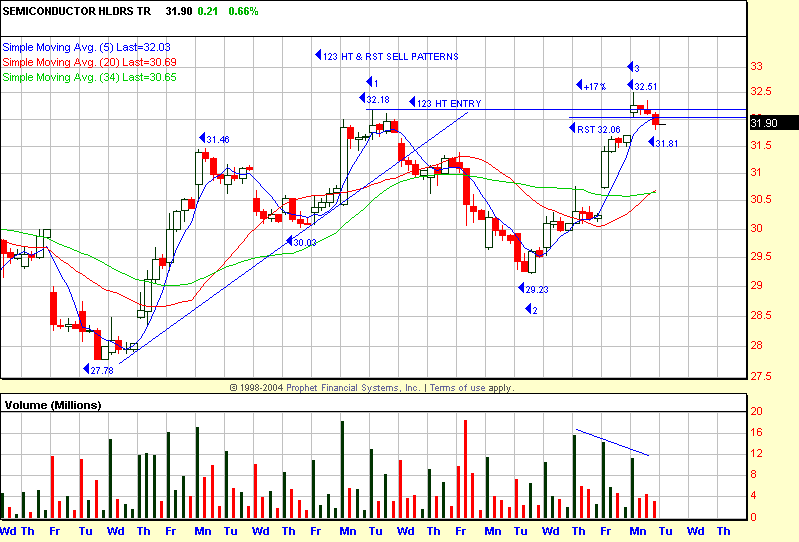
I have included the SMH “520 Trend”
120-minute
chart which outlines the rally off the 09/07 27.78 low. When the SMH took
out
32.18, it set up a 1,2,3 Higher Top and RST which is labeled with the Number
1
point at 31.46. You could have taken either entry below 32.18 or 32.06. It
was
late in the day and the SMH only traded down to 31.81.
Today’s
Action
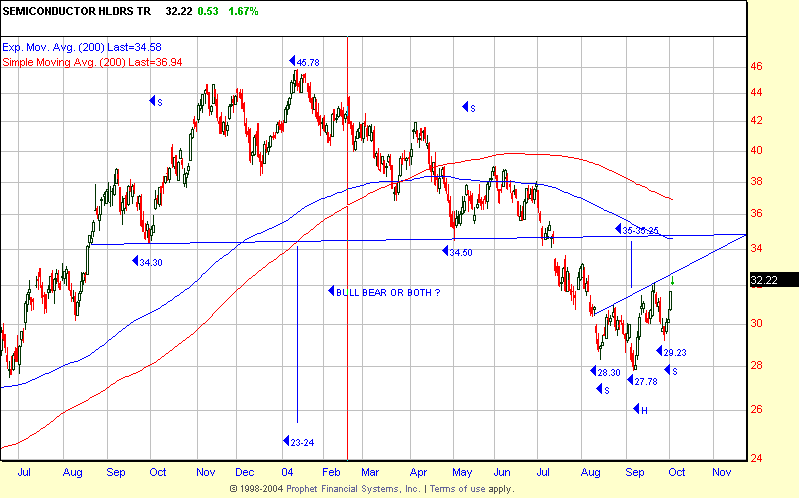
I have also included the SMH daily chart
which
will be at a key price zone if the current inverted head-and-shoulders
breaks
out and trades up to its price objective in the 35 – 35.25 zone. 35 is also
the
2.24 extension of the 31 – 27.78 leg. This level clashes head on with the
more
significant larger head-and-shoulder with the neckline at about 34.50 –
34.75.
This corner thinks the short side will prevail in that zone if the SMH price
advances. The worst case is in that zone you would put on an SMH synthetic
straddle and my guess is that there will be plenty of volatility as the
Generals
get to the exits after, say, a +26% from 27.78 to 35 if that should happen.
There is also confluence with a declining 200-day EMA at 34.58 and the 2.0
extension of the 31 – 27.78 leg at 34.22. The 200-day SMA is up at 36.93,
along
with the 2.618 extension at 36.20. Save this chart as you can make a
significant
play in this zone. Who knows? Maybe the large head-and-shoulder price
objective
will play out, which is down at the 23 – 24 level.
The SPX is right in the 1135 – 1141 price
zone
having closed above the 1131.54 previous swing point high, so that is
today’s
lower minor support focus point as the SPX closed at 1135.13. 1141 would be
the
initial upside focus level.
For the Dow, the overhead line focus is
10,232
and then the 200-day EMA at 10,298, which is also the upper channel
downtrend
line. The Dow closed at 10,216, so the lower minor support price action
zones
are 10,157 and 10,102, which is the 200-day EMA.
Remember, you must start each day with some
frame
of reference so you can just concentrate on the price action in these zones
and
make your decision, long or short, and sometimes both ways, as there can be
a
quick reversal after a magnet level is taken out.
For the SMH, the 32.18 swing point high is
the
immediate upside focus point with minor support below the 31.90 close at the
31.10 – 30.55 level. Volume has declined the past two days as price moved
higher. The shorts that were squeezed as they were following all of the
analysts’ downgrades will be laying them out again if the SMH moves into
that
next price zone of 34 – 37, or if on weakness, price takes out the 50- and
20-day EMAs below which is the 31.10 – 30.55 levels.
Have a good trading day,
Kevin Haggerty
P.S. Spend the next year trading with me.Â
Click here for details.
Â


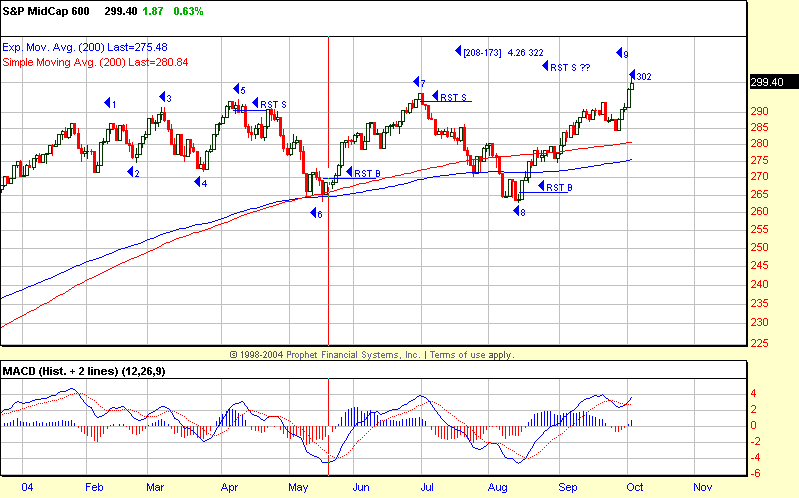
In spite of rising EMA`s the RST`s have been
nice action zones…
Â
