You Get ‘Lucky’ With Defined Setups
What Wednesday’s Action Tells
You
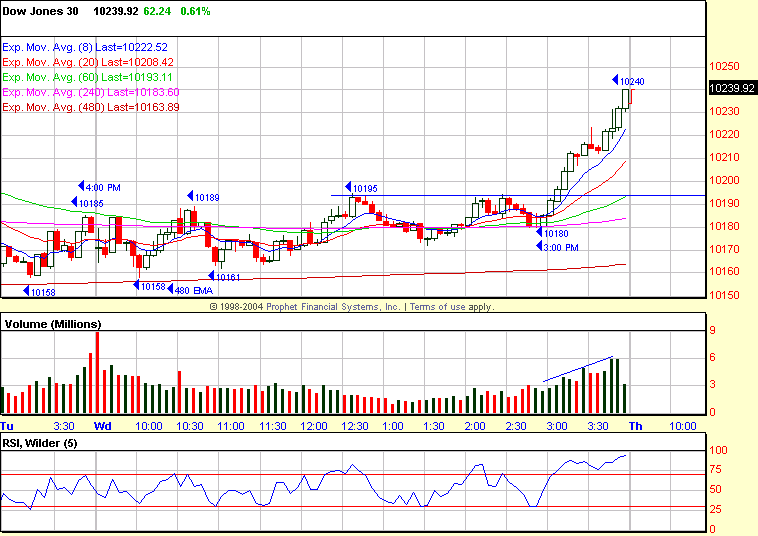
Until the buy programs lit up on the 3:00
p.m. ET
bar and took the SPX
(
$SPX.X |
Quote |
Chart |
News |
PowerRating) up 6.3 points in the last hour to close
at
1142.05, +0.7%, the major indices were in danger of being assessed a
two-stroke
penalty for another delay of price action. The media empty suits were
babbling
about Verizon’s
(
VZ |
Quote |
Chart |
News |
PowerRating) spending plan as the reason for the last-hour move.
The
Dow
(
$INDU |
Quote |
Chart |
News |
PowerRating) closed at 10,240, +0.6%, having held again at the 10,158
minor
support level and providing another long intraday entry opportunity. The
(
QQQ |
Quote |
Chart |
News |
PowerRating) at 36.65 and Nasdaq
(
$COMPQ |
Quote |
Chart |
News |
PowerRating) at 1971 both ended +0.8%.
NYSE volume repeated at 1.42 billion, with
the
volume ratio 75 and breadth +1211, which was up from +686 around 3:00 p.m.
at
the start of the rally. In the sectors, the CYC led at +1.1%, while the BKX,
XBD
and RTH were in line with the SPX. The semis lagged with the
(
SMH |
Quote |
Chart |
News |
PowerRating)
closing
at 32, +0.3%.
For Active
Traders
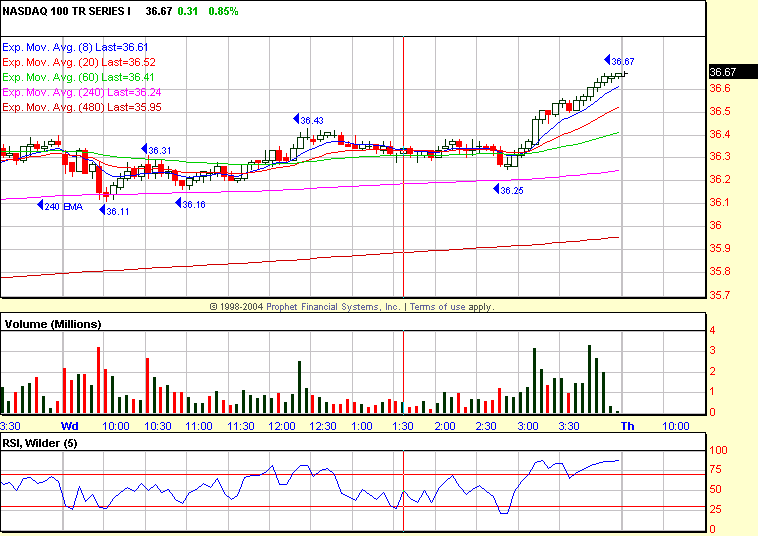
The QQQ provided an early
Trap Door setup at
the
240 EMA and 36.10 minor support level we started the day with. Price hit
36.11
and proceeded to work its way up to 36.43 after a retracement back to the
240
EMA zone and 36.16. The QQQ went Slim Jim from 12:30 p.m. until the breakout
on
the 3:05 p.m. bar above 36.36 and trading up to the 36.65 close. The Slim
Jim
breakout was above all of the EMAs, so it was a continuation trend move and
if
you had your lines drawn, many of you Slim Jim traders caught the buy
program
move. Looking at the five-minute chart, you can see the volume increase
prior to
the breakout.
The key point is that you are lucky as to the
extent of the move, which we cannot know in advance, but you are prepared
for it
if you took the
Slim Jim near the highs of the day because it was a defined
higher probability setup. I have also included the Dow five-minute chart for
those of you who trade the futures and/or DIA. In fact, I assume all of you
futures traders trade the better setups each day from the Dow, S&P and
Nasdaq.
If not, you should. One of the three almost always has a more defined
pattern
relative to what you have learned from
my seminar or module material.
Yesterday
it was a double bounce from the 10,158 minor support level and 480 EMA, and
then
the afternoon breakout from the 10,195 – 10,172 range above all the lines
and
also seeing that both the QQQ and SPX were also breaking out of their Slim
Jims.
Today’s
Action
The problem with the trading since Monday is the
lateral price action after some of the defined entries from some daily
anticipated levels. That always makes it very difficult because you get timed
out as price action goes flat. You are correct in doing that at a small
profit
or scratching the trade because as price/volatility narrows, you can always
re-enter a trade on the next move. For example, look at the five-day QQQ
chart,
and you’ll see the downward sloping Slim Jim since the Monday 36.62 high.
Yesterday’s Slim Jim breakout coincided with a breakout from the larger Slim
Jim. If you trade the QQQ, you must have anticipated a trade based on that
confluence. If not, it is a preparation problem. Both together is much
higher
probability than just yesterday’s Slim Jim.
Being that the SPX is the dominant index of
the
Generals/market and is above all the lines, let’s look at the next
anticipated
zones. The SPX closed at 1142.05, well above the previous 1131.54 swing
point
high and right at the 1141 .786 retracement to 1163 from 1061. If today goes
red, 1131.54 is too far down to enter a 1,2,3 Higher Top trade (see your
daily
chart), so you use that 1141 number as your first focus because your stop is
so
close. The better short side trade will take place above 1146.34 which is
the
06/24 intraday high because if that high is taken out, an RST can form
(daily
chart).
The DIA closed at 102.64 with the 200-day SMA
at
103.18 and must get above 105.05 for any RST to form. For the Dow, it is the
10,298 200-day SMA initial resistance, with the 20- and 50-day EMAs down at
10,167 and 10,163 starting the day and the 200-day EMA down at 10,105.
Because
of this, the Dow is probably the better morning focus.
The 32.18 SMH swing point high is the
immediate
upside focus, not waiting for the 32.51 high to get taken out.
From a longer-term position standpoint, this
corner will not chase price at all right here at this very high risk level.
The
entry at the lowest common denominator and at our anticipated key price
zones is
long passed.
Have a good trading day,
Kevin Haggerty


