Here’s Another Reason Why October Is Significant…
What Friday’s Action Tells
You
The SPX
(
$SPX.X |
Quote |
Chart |
News |
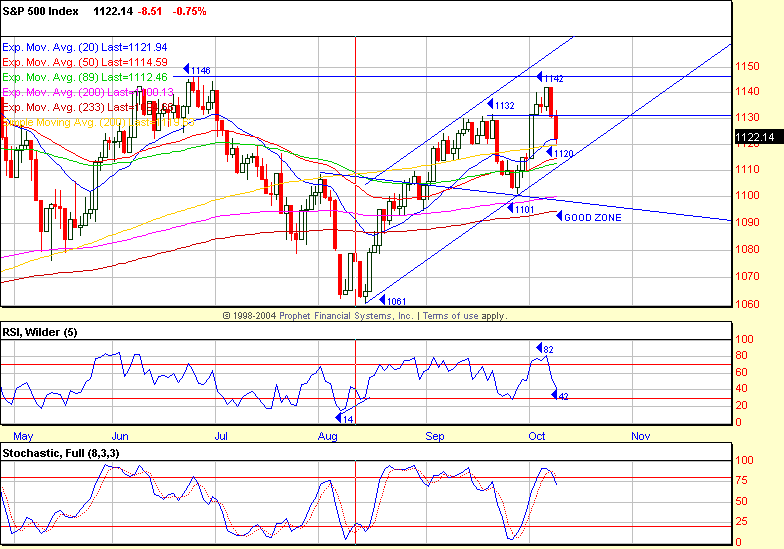
PowerRating) hit the 1141
resistance
again on Wednesday with the 1142.05 intraday and closing high. It
declined -1.9%
to an 1120.19 intraday low on Friday, closing at 1122.14, -0.7%, and was
also
-0.7% on the week. The 200-day SMA is 1120, so that is the immediate focus
today. Minor support is 1114.60 – 1112.40 with primary support from 1100 –
1095.
The Dow
(
$INDU |
Quote |
Chart |
News |
PowerRating) was also -0.7% to 10,055, but was -1.3% on the week
led by
(
MRK |
Quote |
Chart |
News |
PowerRating)‘s recall of Vioxx.
The Nasdaq
(
$COMPQ |
Quote |
Chart |
News |
PowerRating), -1.5% to 1920,
and
the
(
QQQ |
Quote |
Chart |
News |
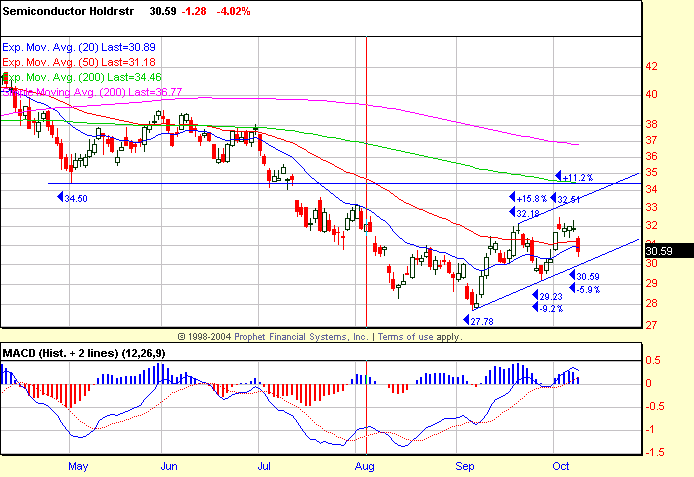
PowerRating), -1.8% to 35.58, were led down mostly by the semiconductors
(
SMH |
Quote |
Chart |
News |
PowerRating) -4.0% on Friday and -3.4% for the week. It was another erratic
first-Friday-of-the-month jobs day as the SPX opened down, trading to
1128.68,
then a contra move up to minor resistance at 1132.92 before resuming the
direction of the open and below all of the EMAs, except the 816 EMA which
was at
1127. The decline was to 1125.43, and price ranged between 1128, straddling
the
816 EMA from 12:45 p.m. ET until breaking that low, trading down to the
200-day
SMA at 1120 and closing at 1122.14.
NYSE volume was the lightest of the week at
1.29
billion shares, with the volume ratio at 28 and breadth very neutral at just
-77, which was better than the major indices price decline. This tells you
volume was again concentrated in the big-cap index stocks with some program
activity.
All of the primary sectors were red, led by
the
SMH, -4.0%, XBD, -1.2%, and CYC, -1.1%, while the XAU was +2.1% and the TLT
(long bond proxy) +1.3% as the slow economic hype prevailed. That slow/fast
hype
seems to change every few days.
For Active
Traders
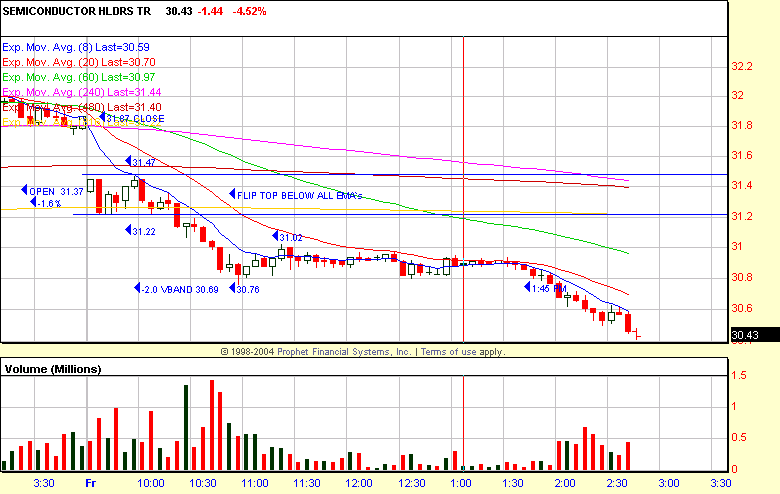
The SMH gave you two trading opportunities in
the
first 90 minutes of trading. I have included the five-minute chart outlining
the
action. The first setup was a Flip Top between 31.47 – 31.22 which traded
down
to 30.76 vs. the -2.0 volatility band at 30.69. Any cover-and-go-long at the
-2.0 volatility band level is a good decision as there was no contra move
yet.
However, it was not to be, as 31.02 was the extent of the reflex prior to
price
drawing a narrow-range Slim Jim pattern into the 2:00 p.m. time period. This
broke down to a 30.41 low, closing at 30.59.
Today’s
Action
The SPX is just two days off its rally high
from
the 1061 low and then the retracement to 1101. The 4 MA of the volume ratio
is
42 and not yet oversold, nor is the 4 MA of breadth at -33. The 5 RSI is 42
and
almost all short-term up moves have started from below 30. The 8,3,3 slow
stochastic has just turned down below 80, so there is nothing positive
(short-term oversold) about the oscillators. For that to happen, the SPX
would
probably have to test support at the 1100 – 1095 level, unless the Generals
come
back and turn price up from the lower channel line and minor support at the
1114.60 – 1112.40 zone. Should price continue to decline into the third week
of
this month, it would set up a long position opportunity as the Generals push
price into year-end. Any normal non-news reflex up today from the 1120
200-day
SMA will meet some resistance at the 1131 – 1132 level, so that could be a
decent intraday short opportunity.
October is also a fiscal year-end for some
large
mutual funds, so they will probably do their best to hold price on any
further
weakness from the 1122 close.
Have a good trading day,
Kevin Haggerty
P.S. Trade with me for a year,
here’s how.


Â

