Get Ready To Play This Initial Retracement
What Friday’s Action Tells
You
Friday was opportunity for daytraders, as the
SPX
(
$SPX.X |
Quote |
Chart |
News |
PowerRating) went trend up from the 10:00 a.m. ET frequent reversal time
period, hitting intraday highs by 1:45 p.m., then drifting lower into the
close.
Both the SPX, 1108.20, and Dow
(
$INDU |
Quote |
Chart |
News |
PowerRating), 9933, finished +0.4% on
Friday,
but were -1.2% on the week. The SPX and
(
QQQ |
Quote |
Chart |
News |
PowerRating) have declined seven days
into
their longer-term EMA price zones, but are certainly not oversold on a
momentum
basis.
The QQQ, 35.60, and Nasdaq
(
$COMPQ |
Quote |
Chart |
News |
PowerRating),
1912,
were also +0.4%. The QQQ actually closed +0.1% for the week and has acted
better
than the SPX, and certainly the Dow.
NYSE volume was the heaviest on the week at
1.65
billion shares with the volume ratio 61 and breadth +1202, both better than
the
+0.4% gain for the SPX and Dow.
The market action and volume picked up after
the
SPX traded down from the opening bar high to the 1102.14 low on the 9:55
a.m.
bar, holding the previous day’s 1102.06 low and just above the 1100.73
200-day
EMA. This support zone also held on the previous swing point low of 1101.29
on
09/28.
The round trip from 1101 to 1142 and back to
1102
has been profitable for the long synthetic straddle put on before 09/20. In
addition, all longer-term index proxy positions have downside protection
into
the election, but if the major indices catch a downside air pocket from
here,
the long side short-term bias will be taken.
For Active
Traders
The
(
SPY |
Quote |
Chart |
News |
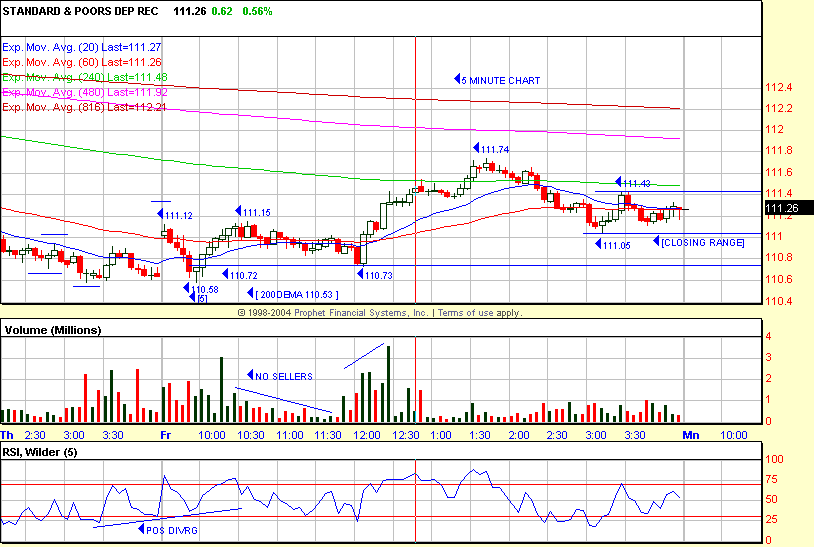
PowerRating) opened up, hitting 111.12 on
the
first bar, then traded down to 110.58 on the 9:55 a.m. signal bar, right at
the
200-day EMA of 110.53. Price closed at the top of that bar, 110.72, and then
you
got entry. The SPY worked its way up to 111.74, but faded into the close at
111.26. You had anticipated the 200-day EMA level, 110.53, to 110, which is
the
233-day EMA. You were also at the frequent 10:00 a.m. reversal period and
were
aware of a possible move in the direction of the gap up opening. RST players
had
even more reason to take the trade.
The ESZ4 entry was above 1103.50, which
traded up
to 1113.75 before closing at 1108.75. If you traded the NQZ4, then the RST
entry
was on the 10:00 a.m. bar above 1428.50. The NQZ4 also gave you experienced
RST
pros a sell side entry which caught the afternoon downtrend.
Today’s
Action
There were six economic reports on Friday, so
there was lots of room for the hedge funds to play games accelerating price
movement. The primary economic reports this week for the media to hype are
the
CPI on Tuesday and the Leading Indicators on Thursday, 10/21.
The SPX closed at 1108.20 and has yet to take
out
the 09/29 1101.29 magnet swing point low, which was the previous retracement
test of the still-rising 200-day EMA. If it does take it out, then an RST
buy
pattern can set up.
Daytraders and short-term traders should be
ready
to play any initial retracement from the SPX 1108.20 close to the 1101 –
1093
zone. The same holds true for the QQQ on a retracement to 35.20 – 35.15 and
then
35 – 34.80. I favor the QQQs over the SPX and Dow because of how they have
traded during this seven-day retracement.
This being the eighth day of the move, maybe
we
will get some travel range and hopefully lower prices into the price zones.
The
immediate upside resistance for the QQQ is the 200-day SMA now 35.82. The
intraday highs on Thursday and Friday were 35.78 and 35.85, so nothing
positive
happens until price can clear that level. This corner would pass on any
intraday
move today through that level if it is a first entry in the morning. I say
that
because I am doing this Sunday for Monday without seeing how the futures are
being gamed, if at all.
Some of the energy stocks have pulled back to
their 20- and 50-day EMAs, like
(
DO |
Quote |
Chart |
News |
PowerRating) and
(
CAM |
Quote |
Chart |
News |
PowerRating), in addition to
(
RIG |
Quote |
Chart |
News |
PowerRating),
(
BHI |
Quote |
Chart |
News |
PowerRating),
(
AHC |
Quote |
Chart |
News |
PowerRating),
(
SUN |
Quote |
Chart |
News |
PowerRating) and
(
XOM |
Quote |
Chart |
News |
PowerRating), just to name a few. They are
still very extended after this retracement, but from a daytrading
standpoint,
you must be ready to get involved if the players show up.
The
(
SMH |
Quote |
Chart |
News |
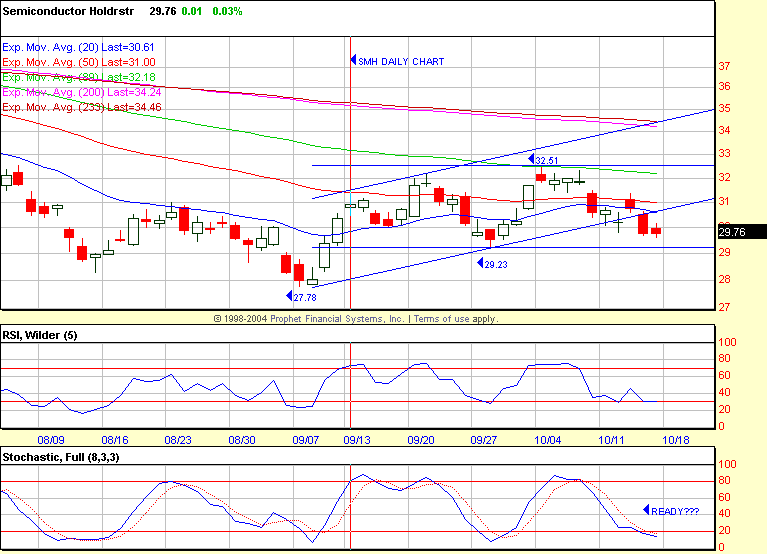
PowerRating)s are still in a 26-day trading
range between 32.51 and 29.23, having closed Friday at 29.76. This is the
low
end of the range, so be ready to get involved.
Have a good trading day,
Kevin Haggerty
Spend the next year trading with me.Â
Click here for details.
Â


