Keep Your Stops Tight And Don’t Increase Position Size
What Friday’s Action Tells
You
Friday’s commentary became reality as the
“one
foot out the door and fingers on the trigger” sent the SPX
(
$SPX.X |
Quote |
Chart |
News |
PowerRating) down
in a knife move right from the opening bell to the minor support level
and
1170.34 close, -1.1%. The Dow
(
$INDU |
Quote |
Chart |
News |
PowerRating) was also -1.1% to 10,457, while
both
the Nasdaq
(
$COMPQ |
Quote |
Chart |
News |
PowerRating), 2071, and
(
QQQ |
Quote |
Chart |
News |
PowerRating), 38.68, were -1.6%. 1188.46
was
the weekly intraday SPX high, stopped cold by the 1191 price zone. Actually,
the
high close was only 1184.17.
November 17 – 19 was the key time date, and
price
had advanced +9.0% in 18 days in a vertical move to the 1191 resistance
level
(11/18/04 commentary), so the extended trading tree becomes more susceptible
to
air pockets, especially on an option expiration Friday.
The semis went red with the
(
SMH |
Quote |
Chart |
News |
PowerRating) -3.0%
following a +8.0% run the previous six days. It was + 2.3% on the week. The
SMH
found minor support in a Slim Jim from 12:30 p.m. – 3:30 p.m. ET Friday at
the
34.06 – 33.85 233-/200-day EMA level, but ticked down into the close at
33.77.
The current high of this SMH rally was 34.85, right at the upper channel
line
and also the .382 retracement to 45.78, which is 34.66.
In spite of the air pocket with no contra
move in
the major indices, daytraders had another excellent day on the longside, as
the
(
OIH |
Quote |
Chart |
News |
PowerRating) went green again at +2.0% and was +7.2% the past four days. This
continuation move in the OIH was +2.2% from entry (above the previous day’s
82.85 high) to the intraday 84.65 high. There were obviously some very
profitable trade-through entries in many of the energy focus
stocks.
NYSE volume was 1.52 billion shares on Friday
with the volume ratio at 44 and breadth -1442. The volume ratio 4 MA is now
44,
and the 4 MA of breadth -240, while the five-day RSI dropped to 46 as the
SPX
closed below the last five days’ lows.
All of the remaining primary sectors (except
XAU,
+1.3%) were red, with the XBD tracking the SMH at -2.5%, BKX -1.4% and the
RTH
-1.3%
Today’s
Action
It is a holiday week and liquidity gets thin,
so
there could be some erratic price movement in either direction. The past two
years have been profitable on the long side for traders with a +3.9% last
year
and +4.8% in 2002 over four trading days from 11/26 (11/19/04
commentary).
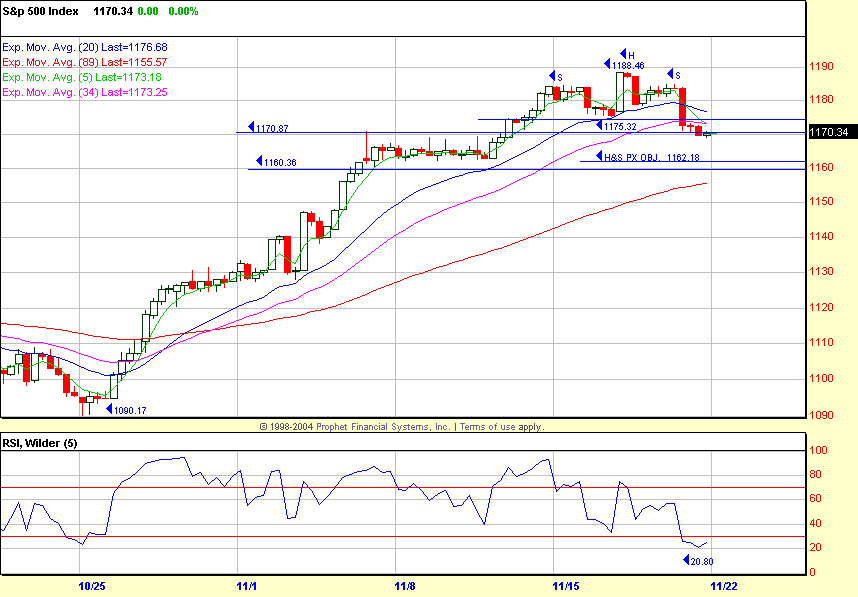
The SPX is back to the previous four-day
consolidation high of 1170.87, with the 1161 .50 retracement to 1553 from
769 as
the next lower price zone of note.
I think the better long side trades will
occur if
the SPX declines Monday and maybe into Tuesday morning closer to the 1162 –
1156
zone. However, up or down, the price movement can be erratic and easy for
the
“players” to push around, so keep your stops tighter and do not
increase your
position size.
The SPX 120-minute chart is included
outlining
the initial retracement zone and the mini head-and-shoulder pattern with a
price
objective in confluence with that 1161 .50 retracement level. This chart is
just
a reminder where the price action might provide some reversals this week for
the
short-term trader.
Have a good trading day,
Kevin Haggerty
P.S. Trade with Kevin for a year.
Click here.

