Generals Protect November Gains Into Month-End
What Friday’s Action Tells
You
The holiday bias held last week as the SPX
(
$SPX.X |
Quote |
Chart |
News |
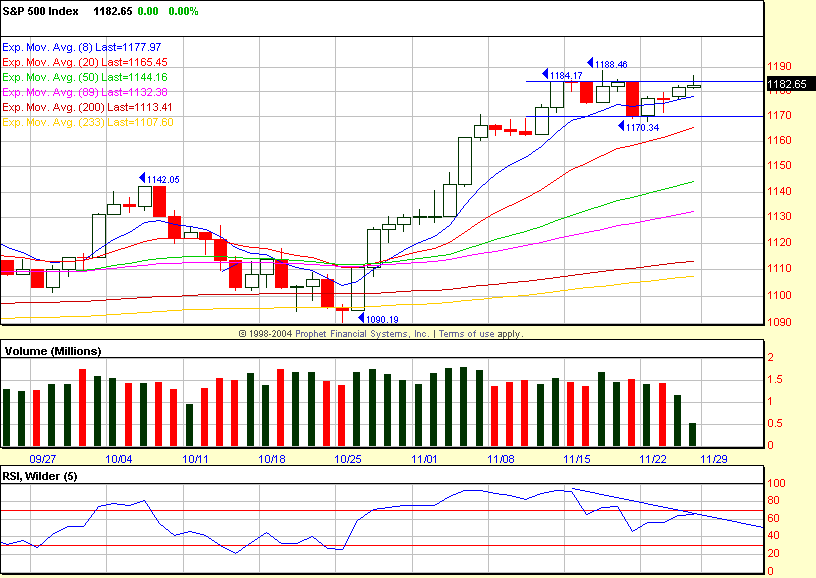
PowerRating) traded from an 1167.89 Monday low to an 1186.62 Friday high,
closing at 1182.65, +1.1% on the week. In fact, the SPX has traded in just a
1.8% range, low-to-high, for the past 10 days, with the high close still
1184.17
on 11/12.
The Generals have a good month going with two
trading days remaining. We start the week with the SPX +4.6% so far in
November,
and I expect them to protect it barring any overt news.
Friday’s holiday trading (NYSE closed at 1:00
p.m. ET), with NYSE volume of 504 million shares, has little significance,
but
the 4 MA of the volume ratio is now 65 and 4 MA of breadth +1016. These
short-term overbought conditions have been worked off sideways this month,
and
as the SPX churns just under the 1191 extension of the 1163 – 1061 leg and
the
1193.91 extension of the most recent leg down from 1142.05 to 1090.19, which
was
the key price and time zone and also a “Generals’ Pullback” entry
(seminar and
sequence trading modules).
The immediate price objective for the SPX
continues to be the .618 retracement zone to the 1553 top from the 769
October
2002 low, which is 1254. That is just a +6.0% move from the current trading
range. There is a confluence with several different sequence numbers from
1220
to 1254.
This corner will be lightening up
considerably on
long index proxy positions into this zone, in addition to selling near-term
out-of-the-money calls on the remaining long allocation and will do the same
each month should the rally continue through 1254. Also, some new synthetic
straddle positions will be initiated into the .618 retracement zone as
implied
volatility screams out, “Buy me.” On the other hand, if this
current range is
resolved to the downside in early December to, say, the 1160 – 1165 .236
retracement to 1090 or the .382 retracement level at 1150 – 1155, this
corner
will get involved on additional longside index proxy positions betting on
the
2004 year-end mark-up by the Generals. The SPX is +6.4% year-to-date, so I
know
the Generals want to get that, and more, on the books at
year-end.
The SPX closed at 1182.65 and is considerably
“above the lines” with the 20-day EMA at 1165.45, 50-day EMA at
1144.10 and
200-day EMA down at 1113.42. The trading tree has been stretched higher, but is
weaker relative to entry at any lowest common denominator, and that is when
it
is susceptible to quick downside air pockets, which I consider a positive to
set
the table for the Generals to play their year-end game.
Monday is the 13th day of the
(
OIH |
Quote |
Chart |
News |
PowerRating)
current
rally off the 89-day EMA and 76.67 low. This is a trade we have been on for
nine
trade-through OIH entries in 12 days. This was a bonanza for daytraders that
made the ride on that trade each day. The OIH advanced +15% during this
current
rally, but many of our focus stocks, like
(
DO |
Quote |
Chart |
News |
PowerRating) +21.5%, have outperformed
the
OIH. I would expect energy stocks to hold most of their current rally gains
through month-end, and then, of course, have some sort of decent retracement.
The
(
SMH |
Quote |
Chart |
News |
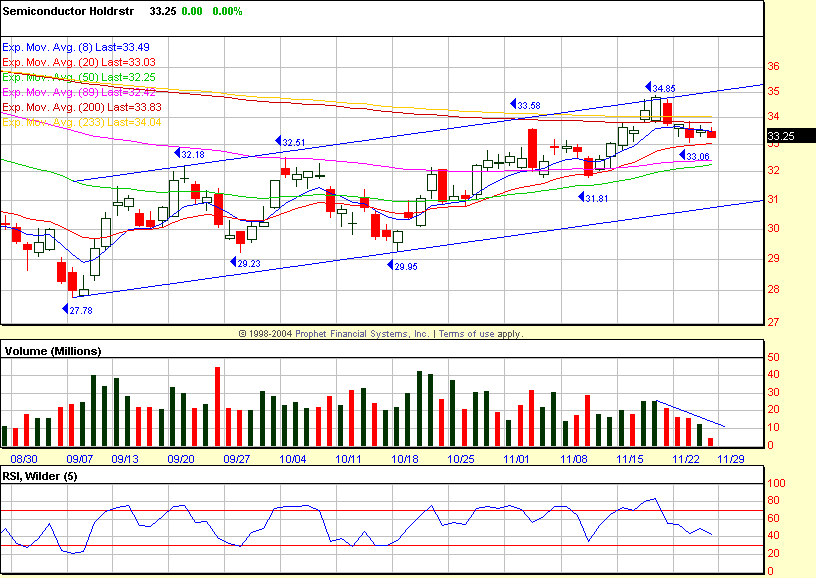
PowerRating) gained +9.6% low-to-high
(34.85) in
the last six days and traded through the 233-/200-day EMAs of 33.83 and
34.04.
The SMH closed at 33.25 and has retraced in the past five days on lower
volume
each of these days. Hedge funds will try to accelerate price on any re-cross
of
the 33.83 – 34.04 zone. The 20-day EMA is 33 with the 89- and 50-day EMAs
from
32.42 – 32.25, so you have a frame of reference.
This is being done Sunday for
Monday.
Have a good trading day,
Kevin Haggerty
Trade with Kevin for a year.
Click here for details.


