Did You Take This Key Trade Yesterday?
What Tuesday’s Action Tells
You
The SPX
(
$SPX.X |
Quote |
Chart |
News |
PowerRating) 1191 level was
resolved
yesterday after trading in a range all morning between 1192.19 – 1188.60. It
was
knife down from 12:30 p.m. ET to an intraday low of 1177.07 on the last bar
and
closing at 1177.08, -1.1% on the day.
This is a positive, as short-term downside
pressure is needed to set the table for a Generals’ mark-up into year-end if
they intend to make a double-digit year for those that are at least matching
the
SPX performance (12/06 commentary).
The Dow
(
$INDU |
Quote |
Chart |
News |
PowerRating) closed at
10,441, -1.0%,
Nasdaq
(
$COMPQ |
Quote |
Chart |
News |
PowerRating) at 2115, -1.7%, and the
(
QQQQ |
Quote |
Chart |
News |
PowerRating)s at 39.58, -1.7%.
NYSE volume expanded a bit to 1.53 billion shares with the volume ratio very
negative at 17 and breadth -1741. In fact, the downside volume yesterday at
1.26
billion was just below Monday’s total volume of 1.35 billion. The 4 MAs of
both
the volume ratio and breadth were working off a short-term overbought
condition
as the SPX has traded sideways under the 1190 – 1195 resistance zone for the
past 17 days.
The primary sectors were all red, led by the
(
OIH |
Quote |
Chart |
News |
PowerRating), -2.3%, as oil traded lower again, the
(
SMH |
Quote |
Chart |
News |
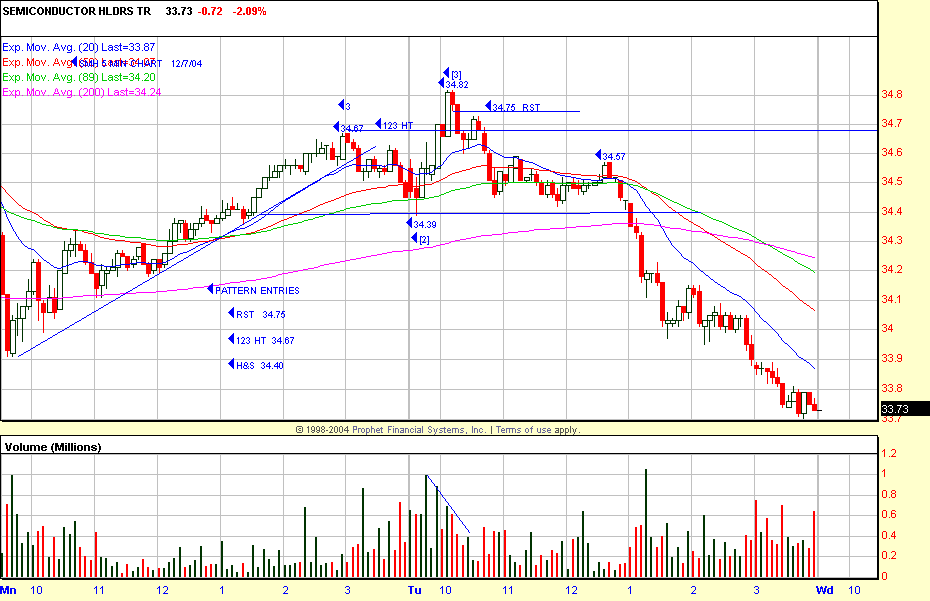
PowerRating), -2.1%, to 33.73
and
the CYC, -1.6%.
For Active
Traders
The SMH was the key trade yesterday for those
of
you with the
strategy modules. The intraday high was 34.82 on the 10:05 and
10:10 a.m. bars, setting up the
1,2,3 Higher Top from the previous day’s
action.
Entry was below 34.67, but those of you who know RSTs took entry below
34.75.
The SMH traded down to a 33.73 close. The late-to-the-party daytraders still
did
okay if they took the downward sloping head-and-shoulder breakout below
34.40.
Today’s
Action
The SPX closed at 1177.07 with the 20-day EMA
at
1175.28 and price has not touched the 20-day EMA since the bounce off the
10/25
bottom. This becomes a daytrader’s initial focus this morning on the daily
chart, whether it be a cross, re-cross, or both. The five-minute chart setup
will determine how you enter the game today. The previous daily chart
closing
range high of 1184.17 once again becomes upside resistance and not waiting
for
the 1197.46 intraday high to get taken out, as many textbook traders do. On
the
120-minute chart, there is initial resistance at 118.75 and 118.90. On the
five-minute chart, it is the 20 EMA starting the day at 118.32 for any
possible
early entry.
This corner would prefer to see more downward
price pressure into next week’s mid-December time period, and at that point
the
media drones will be negative enough for a good bounce to the upside. Wave
five
of this bull cycle is not over, and weakness can be bought.
Daytraders should only play the short side on
intraday retracements. The SPY RST buy setup on the 120-minute chart is if
price
trades below 117.25, and 117 is also the bottom of the previous daily chart
trading range.
The SPY price is extended to the -3.0
five-day,
five-minute bands and the 20-day, 30-minute bands have the -2.0 at 117.75
and
the -3.0 at 116.90, so this is the daytrader’s initial downside focus
today.
The early futures are flat at 8:30 a.m., but
an
early selloff will set the table for a quick Trap Door contra
move.
Have a good trading day,
Kevin Haggerty

