Here’s the long setup in Internet stocks
Stocks followed up Tuesday’s
lethargic session with a strong session of broad based gains yesterday,
as higher volume across the board confirmed the rally. Shrugging off the prior
day’s Federal Reserve interest rate increase, the major indices trended steadily
higher throughout the entire session and finished at their intraday highs. A
recovery in the Semiconductor Index, which popped back over its 200-day MA,
enabled the Nasdaq Composite
(
COMP |
Quote |
Chart |
News |
PowerRating) to power 1.4% higher. The S&P 500
(
SPX |
Quote |
Chart |
News |
PowerRating)
turned in a quite respectable gain of 1.0%, but the Dow Jones
(
DJX |
Quote |
Chart |
News |
PowerRating) lagged
behind and closed only 0.6% higher. As we often see during a healthy market,
small caps showed relative strength that caused the Russell 2000 to charge 2.2%
higher. The S&P 400 Midcap Index similarly advanced 1.8%.
The most important thing about Wednesday’s rally is that it
was backed by strong institutional demand. Total market volume in the NYSE
surged 11% higher, while volume in the Nasdaq was 13% higher than the previous
day’s level. Not only was volume well above average levels in both exchanges,
but it was the highest volume “up” day in the Nasdaq since September 16. This
tells us that mutual funds, hedge funds, and other institutional investors
supported yesterday’s “accumulation day.” It is estimated that more than 70% of
the stock market’s daily volume is the result of institutional activity. As
such, participation by institutions, as opposed to solely retail investors, is
necessary in order to sustain market rallies. Strong market internals also
confirmed the broad-based buying.
Unlike recent rally attempts the broad market has had over the
past several weeks, yesterday’s gains were broad-based across nearly every
industry sector. Only two industry sectors we follow, Software
(
GSO |
Quote |
Chart |
News |
PowerRating) and
Pharmaceutical
(
DRG |
Quote |
Chart |
News |
PowerRating), closed in the red yesterday. Conversely, more than
half of the 23 sectors we monitor daily gained more than 1.5%. The top sector
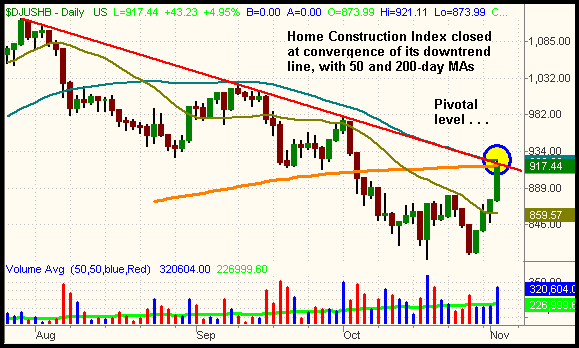
gainer yesterday was the DJ Home Construction Index ($DJUSHB), which rocketed 5%
higher in heavy trade. Upon taking a look at both the short and long-term
charts, we noticed the sector closed right at key trendlines yesterday.
The $DJUSHB sector, which we have shorted several times over
the past three months, has been in a steady downtrend since its high of July
2005. However, the sector appears to have formed a double bottom last month and
closed yesterday right at resistance of its daily downtrend line, as well as its
50 and 200-day moving averages. If the sector is able to power through
convergence of these three resistance levels, it will trigger a short-term buy
signal because the bears who have been short the downtrend will be forced to
cover. If this occurs, the index could attempt to recover back to its prior
high, or at least into its 61.8% Fibonacci retracement level. Notice how the
index closed right at convergence of its downtrend line and 50/200-day MAs
yesterday:

The double bottom that formed last month may provide the
technical support necessary for the index to break the resistance levels circled
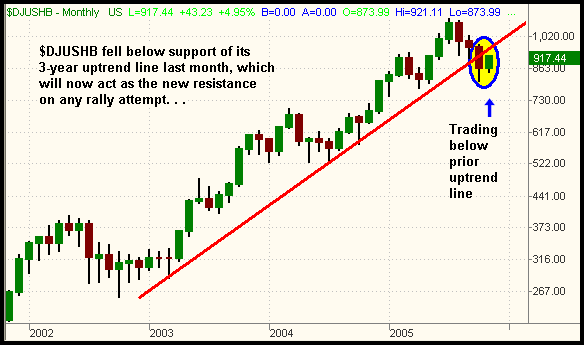
above, but another challenge may be the long-term monthly chart of the sector:

As you can see, the $DJUSHB sector broke below support of its
3-year uptrend line last month and now has rallied into resistance of that prior
uptrend line (remember that prior support becomes the new resistance after the
support is broken). Obviously, it may be challenging for the sector to break out
above this prior uptrend line, but it is entirely possible that a new,
less-steep monthly uptrend line will form instead. We point out the long-term
chart just to keep the “big picture” of the sector in perspective with the
potentially bullish trend reversal on the daily chart. Like we discussed in
yesterday’s Wagner Daily, looking at long-term charts helps to prevent
fighting a greater trend that may be in the opposite direction. If interested in
playing the Home Construction sector, there is not an ETF that directly tracks
it, but you can make your own “synthetic ETF” by trading a small basket of the
leading stocks in the index. Some names to look at, in no particular order, are:
(
PHM |
Quote |
Chart |
News |
PowerRating),
(
LEN |
Quote |
Chart |
News |
PowerRating),
(
RYL |
Quote |
Chart |
News |
PowerRating),
(
KBH |
Quote |
Chart |
News |
PowerRating),
(
DHI |
Quote |
Chart |
News |
PowerRating),
(
HOV |
Quote |
Chart |
News |
PowerRating),
(
TOL |
Quote |
Chart |
News |
PowerRating), and
(
BZH |
Quote |
Chart |
News |
PowerRating).
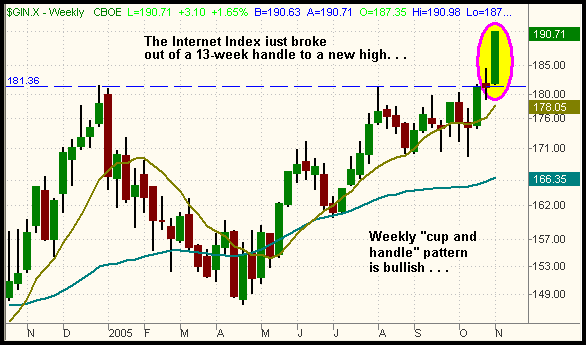
Upon scanning all the long-term sector charts, the most
bullish looking one is the Internet index ($GIN), which just broke out of a
weekly cup and handle pattern and closed at a fresh 4-year high:

Because the sector is trading at a multi-year high, there
technically is no overhead resistance to contend with. The sector has rallied
sharply for three straight days, but we view it as a good play to buy on any
pullback to near the breakout level.
(
HHH |
Quote |
Chart |
News |
PowerRating) (Internet HOLDR) is a popular ETF
that tracks the Internet stocks. Among the biggest individual stocks within the
sector are:
(
GOOG |
Quote |
Chart |
News |
PowerRating),
(
EBAY |
Quote |
Chart |
News |
PowerRating),
(
YHOO |
Quote |
Chart |
News |
PowerRating), and
(
AMZN |
Quote |
Chart |
News |
PowerRating).
As for the broad market, the S&P finally closed above
resistance of its 50-day MA yesterday, as well as its daily downtrend line from
the September high. This enables us to feel more confident about re-entering the
long side of the stock market. The Nasdaq Composite also finished just a hair
above resistance of its daily downtrend line from the August high. This further
confirms the broad market reversal, but the Dow continues to hang out below its
200-day MA. We are now shifting from a neutral into a cautiously bullish bias,
although we are concentrating the most on individual sectors with relative
strength to the broad market. This is probably safer than trying to buy the
broad market ETFs here. Regular subscribers will see a new sector ETF setup for
potential long entry below.
Open ETF positions:
We are currently flat (regular subscribers to
The Wagner Daily receive detailed stop and target prices on open
positions and detailed setup information on new ETF trade entry prices. Intraday
e-mail alerts are also sent as needed.)
Deron Wagner is the head trader of Morpheus Capital
Hedge Fund and founder of Morpheus Trading Group (morpheustrading.com),
which he launched in 2001. Wagner appears on his best-selling video, Sector
Trading Strategies (Marketplace Books, June 2002), and is co-author of both The
Long-Term Day Trader (Career Press, April 2000) and The After-Hours Trader
(McGraw Hill, August 2000). Past television appearances include CNBC, ABC, and
Yahoo! FinanceVision. He is also a frequent guest speaker at various trading and
financial conferences around the world. For a free trial to the full version of
The Wagner Daily or to learn about Deron’s other services, visit
morpheustrading.com or send an e-mail
to
deron@morpheustrading.com .
