Broad market correction this week?
The major indices closed with mixed
results last Friday, as both the S&P 500
(
SPX |
Quote |
Chart |
News |
PowerRating)
and Dow Jones Industrial Average
(
DJX |
Quote |
Chart |
News |
PowerRating) broke their five-week winning
streaks. The S&P oscillated in a narrow trading range of less than six points on
Friday’s session before finishing unchanged. The S&P Midcap 400
(
MDY |
Quote |
Chart |
News |
PowerRating) and
small-cap Russell 2000 indices
(
RUT |
Quote |
Chart |
News |
PowerRating) each closed flat as well. Strength in
the tech and biotech-related sectors enabled the Nasdaq Composite to show
relative strength and gain 0.3%. The Dow Jones, conversely, fell 0.3% for the
day. The S&P 500 lost 0.3% for the week, while the Dow shed 0.5%. The Nasdaq
Composite, however, logged its seventh straight week of gains by
advancing another 0.5%. The index also closed out the week at a new four-year
high.
Total volume in the NYSE declined by 14% in last Friday’s
session, while volume in the Nasdaq was 13% lower than the previous day’s level.
Market internals were mixed. Because most of the indices closed near the flat
line and held on to their previous day’s gains, Friday’s session could be
interpreted as a consolidation day. As such, the decline in volume was positive
because it showed that the bears did not take advantage of the opportunity to
unload shares into the prior day’s rally. If volume had increased, it would have
indicated bearish "churning" action. Regardless, the broad market still
experienced two bearish "distribution days" last week, which certainly warrants
a bit of caution on the long side this week.
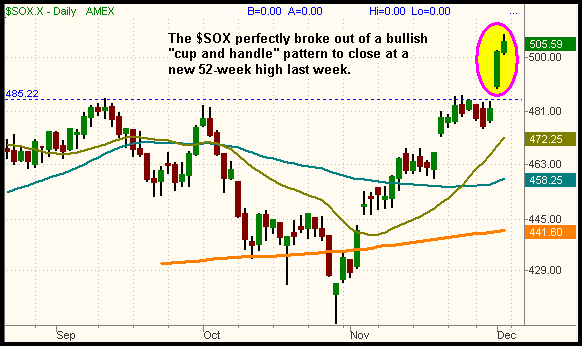
One of last week’s most important sector performances was
given by the Semiconductor Index
(
SOX |
Quote |
Chart |
News |
PowerRating), which vaulted 4.3% higher to finish
at a fresh 52-week high. As you may recall, we were monitoring both the $SOX
index and
(
SMH |
Quote |
Chart |
News |
PowerRating) (Semiconductor HOLDR) for a potential breakout of sideways
consolidation in the beginning of last week. Like textbook, the breakout
occurred on Thursday and both $SOX and SMH added a little more to the breakout
on Friday. Without a doubt, last week’s strength in the Semiconductors was
largely responsible for the Nasdaq locking in another week of gains. Because the
Semis are so heavily weighted, the Nasdaq tends to follow the direction of the
$SOX. If the $SOX would not have broken out of its range, the Nasdaq would have
finished the week in the red. This is why we pay so much attention to and
frequently discuss the performance of the Semis. The daily chart of the $SOX
below illustrates the breakout from its nearly two-week consolidation:

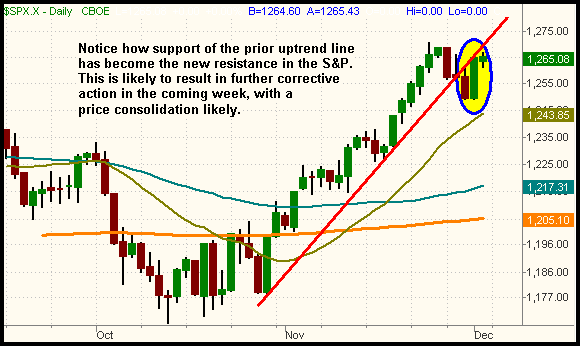
The S&P 500 fell below its 22-day uptrend line with last
Wednesday’s selloff. Since then, it has attempted to recover, but is now running
into resistance of that prior uptrend line. This is a good example of how a
prior support level becomes the new resistance level after the support is
broken. We have circled this new area of trendline resistance on the daily chart
of the S&P below:

The break of that steep uptrend line, combined with the first
correction in six weeks, could provide the impetus to see further broad market
correction in the coming week. At the very least, the weekly charts indicate
that we will probably see at least a sideways consolidation in many sectors this
week. However, don’t forget that the major indices are all trading at or near
multi-year highs. Therefore, there is technically not a lot of resistance
created by overhead supply. Like water running down a hill, the stock market
always follows the path of least resistance. As long as the bears stay away,
even a minor amount of buying pressure could enable the markets to advance
higher in the coming days, regardless of whether or not stocks are looking a bit
overheated. Our bias remains bullish overall, but we are very cautious about
entering new positions on the long side this week (except perhaps within
the $SOX). Instead, you may be better off to focus on managing existing open
positions.
Open ETF positions:
Long BBH (regular subscribers to
The Wagner Daily receive detailed stop and target prices on open
positions and detailed setup information on new ETF trade entry prices. Intraday
e-mail alerts are also sent as needed.)
Deron Wagner is the head trader of Morpheus Capital Hedge Fund and founder of
Morpheus Trading Group (morpheustrading.com),
which he launched in 2001. Wagner appears on his best-selling video, Sector
Trading Strategies (Marketplace Books, June 2002), and is co-author of both The
Long-Term Day Trader (Career Press, April 2000) and The After-Hours Trader
(McGraw Hill, August 2000). Past television appearances include CNBC, ABC, and
Yahoo! FinanceVision. He is also a frequent guest speaker at various trading and
financial conferences around the world. For a free trial to the full version of
The Wagner Daily or to learn about Deron’s other services, visit
morpheustrading.com or send an e-mail
to deron@morpheustrading.com .
