Techs Sliding, But Signs Of Buying Appear
Tech
is still where it’s not, as the majority of technology stocks continue to slip
slide away. As investors pile into old-economy safe havens such as Wal-Mart
(
WMT |
Quote |
Chart |
News |
PowerRating)
and Merck
(
MRK |
Quote |
Chart |
News |
PowerRating),
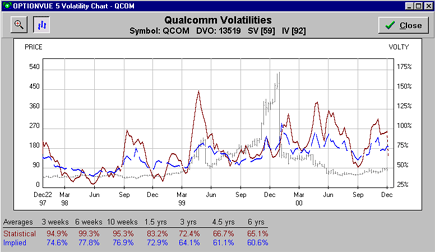
they flee tech stalwarts like Qualcomm
(
QCOM |
Quote |
Chart |
News |
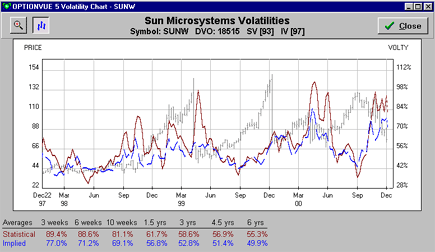
PowerRating), Sun Microsystems
(
SUNW |
Quote |
Chart |
News |
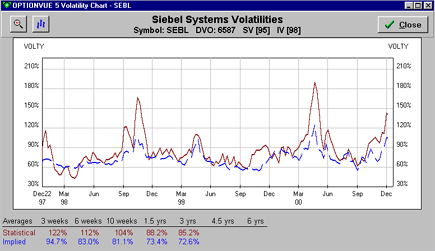
PowerRating) and Siebel Systems
(
SEBL |
Quote |
Chart |
News |
PowerRating).


However, there is some light at the end of the tunnel. Let’s just hope it’s not
a train!
The light that I’m talking about is the dollar-weighted volume of calls
accumulated in certain tech names. The list I’ve included demonstrates the
bullish action in QCOM, SUNW and SEBL. For instance, we see that about twice as
many calls as puts have traded in QCOM, but the more telling statistic is the
4-to-1 ratio of dollar-weighted calls trading.
Even more interesting to us is the action, although still light, in SEBL
options. A total of just under 6,000 options have traded, but take a look at the
dollar-weighted ratio of 10-to-1, and you may see more than the other numbers
show.
Again, how we use this data is to see the money flows of big players into, or out of,
a given security. Straight volume figures are seldom interesting to us, but a
player buying real ($5 or higher) call or put options is much more valuable than
2000 calls or puts trading for 1/4.
|
Symbol
|
Call
|
Put
|
$W
|
$W
|
|
PEP
|
|
|
|
|
|
QCOM
|
|
|
|
|
|
CSCO
|
|
|
|
|
|
SUNW
|
|
|
|
|
|
QQQ
|
|
|
|
|
|
INTC
|
|
|
|
|
|
SEBL
|
|
|
|
|
|
C
|
|
|
|
|
|
MSFT
|
|
|
|
|
|
MER
|
|
|
|
|
|
MRK
|
|
|
|
|
The
volatility index, for the various indices we track, indicates a mild slip in
volatilities, but nothing substantial. Therefore, despite the relatively good
news from the US Supreme Court, Wall Street remains cautious, not bullish.
Volatility
Matrix
|
12/4/2000
|
|
|
Symbol
|
Volatility
|
|
$SOX
|
99.89
|
|
HHH
|
94.11
|
|
SMH
|
91.03
|
|
QQQ
|
79.11
|
|
$MNX
|
76.16
|
|
$NDX
|
76.22
|
|
BBH
|
74.23
|
|
$RUT
|
39.57
|
|
$OEX
|
31.32
|
|
$SPX
|
28.70
|
|
$DJX
|
25.25
|
Do you have a follow-up question about something in this column or other questions about trading stocks, futures, options or funds? Let our expert contributors provide answers in the TradingMarkets Question & Answer section! E-mail your question to questions@tradingmarkets.com.
For the latest answers to subscriber questions, check out the Q&A section, linked at the bottom-right section of the TradingMarkets.com home page.
