Intraday Ascending Triangles: Where I Enter, Where I Place My Stop
WhenÂ
people look for ascending triangles, descending triangles, and
cups-with-handles, they often think that they have to be used for huge
multiple-day moves. Why not use these patterns for daytrades? It seems so
logical to me:Â Enter a position on
the initial move and lock in your gains before the day ends. Personally,
I like to sleep easy, without any positions on the brain.
Many daytraders only take positions based on patterns that they find on intraday
charts, such as a five-minute chart. I find that it is better to use a
combination of intraday setups and daily setups. Why limit yourself to what you
find in the middle of the day? Why not use those same patterns that you would
for a swing trade, and daytrade them? The descending triangle is a
perfect example of this type of pattern.
The Descending
Triangle Defined
The descending
triangle is a pattern that can be formed over several days or several weeks, and
it looks just like it sounds. As with any pattern, the strength of the formation
grows with the amount of time that it takes to form. There is more support
behind a triangle that forms over three weeks than one that forms over three
days.
This type of triangle
is formed when a specific support area is tested a minimum of three times, but
ideally, at least five times. While support is being tested, each price bar
following the first bar in the series should show a lower low. This means
that each consecutive price bar must not trade as high as the previous high.
Of course, this is
merely a textbook description of the setup. What you find in the modern-day, and
currently choppy, market may have several price anomalies.
Using
the Ascending Triangle For Daytrading
Often
in my writings you’ll notice that I mention that swing traders should wait to
open a position on the day following the breakout, because so many moves only
last for one day and fail. These moves are what I refer to as “false
breakouts.” Daytraders, on the other hand, are usually looking to go home
flat at the end of each day, and thus are not subject to many of the problems
resulting from holding failed breakouts from daily patterns overnight. As a
daytrader, I would prefer to lock in my gains each day, and rest easy. That is
not to say that I will never hold a position overnight.
Placing
Your Stops
Consider
placing an initial stop just over the support level that was broken, because if
the stock retraces, it should, ideally, not rise back above support. If it does
break this key level, then it may be that the setup has been invalidated. Of
course, there is no mechanical system for stop placement. In some cases, you may
be stopped out only to see the stock fall back below support. At this point, you
need to re-evaluate the formation, to determine if a second entry is appropriate.
It is crucial to all trading to choose a stop loss point before opening any
position.
Real
World Examples
The example
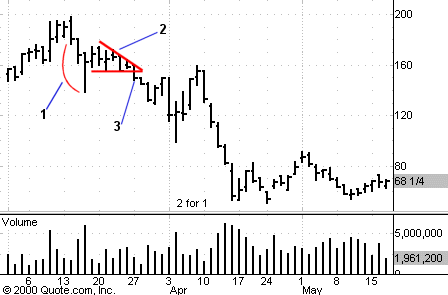
of Redback Networks applies to both daytraders and swing traders. After surging
lower (point 1) for three consecutive days, the stock finally settled into a
mini-consolidation. For the next six days it set a series of lower highs as it
continued to test the same resistance level (point 2). Finally, it broke down
below the trading range (point 3), and a short position is opened. After going
short, a trader would place his initial buy-stop just over the support level.
The daytrader
would have ridden the stock lower, trailing his stop in accordance with the
intraday charts, as he searches for a prudent exit point.
A swing
trader could have followed the position down almost 40 points, trailing his stop
based on price movement.
In this
example, I did not see a move below support on strong volume, so I would tend
not to hold the position overnight. I like to see the stock trade below support
on double the average volume (or greater).

Conclusion
This
pattern, like its counterpart, seems so simple, but you may find that it leads to
consistent gains. A chart pattern is a chart pattern is a chart pattern. Traders
should not limit themselves to applying chart patterns only to specific stocks and
specific time frames. By expanding your use of patterns and looking to applying
them to different charts, you will open yourself to more opportunities.
Remember, as daytraders, it is always good to have numerous ideas for each
trading day.
Â
Â
Â
For The Best Trading
Books, Video Courses and Software To Improve Your Trading
