Intraday Magic
The
background music from Florida remains the same but
there were some
excellent opportunities, especially the defined patterns in the
Nasdaq 100
(
NDX |
Quote |
Chart |
News |
PowerRating), S&P 500 cash
(
SPX |
Quote |
Chart |
News |
PowerRating) and the S&P futures. The NDX 100 gapped down 92 points or 3.2% on
the open, then traded down three more bars and gave you a textbook Trap Door
pattern entry. The setup bar was the narrow-range 9:40 a.m. bar which had
followed the wide-range bar down that closed in the bottom of its range.Â
Entries were in the
(
QQQ |
Quote |
Chart |
News |
PowerRating)s as the NDX traded above the 2790 high of the narrow-range low bar.
The contra rally started after the NDX had declined 4% from the previous close
of 2891.35 to the narrow-range-bar low of 2775.87, or on the 9:45 a.m. bar. The
rally was good for 2.7% before heading south to make the intraday low of 2742.47
at 12:30 p.m. From that low, the
index reversed the intraday down trendline and set up a 1-2-3 which I covered in
the seminars. The #2 swingpoint
high was 2776.86, then pulled back three bars to 2750.41, which is the #3
swingpoint, and it just happened to be the .618 retracement level to the 2742.47
intraday low. Entry on this 1-2-3 pattern was above the swingpoint #2 high of
2776.86. The ensuing rally carried the NDX 100 to the intraday high of 2969.62,
which was 192.76 points or 6.9% from entry. The index then faded the last 45
minutes of the day to close at 2836.62.Â
This is a very common
pattern that repeats very often, especially after big downs. First, you get a
break of the down trendline, then a geometric retracement and a continuation
move above the #2 point. FYI, the
1.5 standard deviation band was 2753, and the intraday low was 2742.47, before
the NDX 100 reversed that band as it broke the down trendline.Â
If you had prepared your
volatility bands, you were immediately looking for entry and got a lucky break
with a basic 1-2-3 pattern. You
have the tools to take advantage of these kinds of trades but if you are not
looking for them, the train will leave without you. At the same time that the
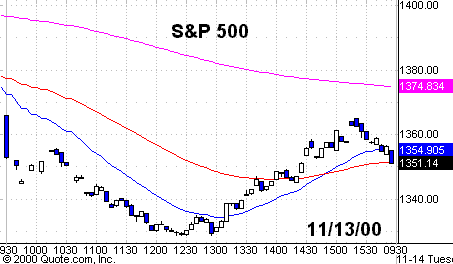
NDX 100 gave us the 1-2-3 pattern and volatility band entry, the S&P futures
and S&P 500 cash had blinking neon lights telling you, “Get on
board!” Both of them gave us
a tight 5 swingpoint RST buy pattern with entry coming above the high of the low
bar which was 1334.03. The S&P 500 cash rallied to an intraday high of 1365
before closing at 1351.35. You do the math if you were trading the futures or
the SPYs. Based on how it traded up, you would have caught
most of the move.
I will be covering these
patterns and many more in my next seminar which will be held in Naples, Fla.,
next Feb. 23, 24 and 25. The RST pattern will only be taught at the major
seminars. If you plan to attend, contact jeanniea@tradingmarkets.com
and she will let you know when the information will be sent out. At the
suggestion of some of the New York seminar attendees, I am planning a more
interactive seminar to make sure you grasp all of the materials and there is no
gray area at the completion of the seminar. Save the five-minute charts from
yesterday on the NDX 100, S&P December futures and the S&P 500
cash.   Â
face=”arial, helvetica”>(December Futures) | ||
Fair | size=2>Buy | size=2>Sell |
7.90 | 9.05 | 6.65 |
Pattern
Setups
The reactionary mode due to
the volatility continues to be the best action. The biotechs have now joined the
chosen ones as the biotechs slid 11% yesterday and could have a continuation
move down today. The semis had a decent day yesterday with the SOX +4.3% and
several of them showed up on our screens.Â
On the 3-Day-Wake-Up-Call,
we have
(
TXN |
Quote |
Chart |
News |
PowerRating) and
(
TER |
Quote |
Chart |
News |
PowerRating), but if they jump out too quickly, look for a
pullback setup. Also look at
(
INTC |
Quote |
Chart |
News |
PowerRating),
(
MU |
Quote |
Chart |
News |
PowerRating), and
(
AMD |
Quote |
Chart |
News |
PowerRating). Other stocks
(
SIAL |
Quote |
Chart |
News |
PowerRating),
(
VSTR |
Quote |
Chart |
News |
PowerRating),
(
EMC |
Quote |
Chart |
News |
PowerRating),
(
GP |
Quote |
Chart |
News |
PowerRating) and in the retail look at
(
LTD |
Quote |
Chart |
News |
PowerRating),
(
ADBE |
Quote |
Chart |
News |
PowerRating) (on a recross of the 50 to the upside) and also
(
CHKP |
Quote |
Chart |
News |
PowerRating).Â
On the short side,
continuation shorts in the chosen ones below yesterday’s lows with tight stops
and also the biotechs if we get any follow-through on the downside, look to
short
(
AMGN |
Quote |
Chart |
News |
PowerRating),
(
GENZ |
Quote |
Chart |
News |
PowerRating),
(
CHIR |
Quote |
Chart |
News |
PowerRating) and also the BBHs.
Have a good trading day.


Do you have a follow-up question about something in this column or other questions about trading stocks, futures, options or funds? Let our expert contributors provide answers in the TradingMarkets Question & Answer section! E-mail your question to questions@tradingmarkets.com.
For the latest answers to subscriber questions, check out the Q&A section, linked at the bottom-right section of the TradingMarkets.com home page.
