Ciena Completing Bases
News of strong fundamentals Thursday
ignited sharp gains in fiber-optics stocks. This is an exciting industry. But even in leading groups, not all stocks are created equal. Charts make finding the leader clear-cut.
Finisar
(
FNSR |
Quote |
Chart |
News |
PowerRating), Global Crossing
(
GBLX |
Quote |
Chart |
News |
PowerRating)
and Ciena
(
CIEN |
Quote |
Chart |
News |
PowerRating) all surged ahead on positive news. Ciena stands out as the
superior candidate for the intermediate-term momentum trader.
Unlike Finisar and Global Crossing,
which are struggling to lift themselves off deep post-correction lows, Ciena is
closing in on its all-time high of 189 set on March 2. As of Wednesday’s close,
Ciena held a TradingMarkets relative strength score of 91 for the past 12
months.

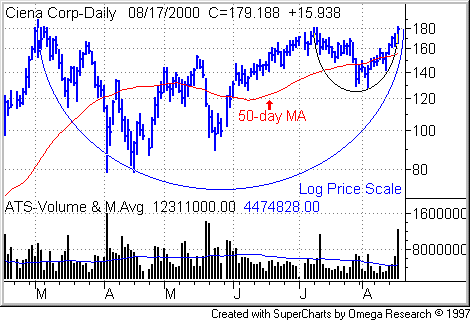
Ciena shares gained 15 15/16 to 179
3/16 on triple normal volume. Notice how the stock is simultaneously nearing the
completion of a long-term base (see blue arc in the above chart) and a
short-term base (see black arc).
The maker of fiber-optic networking
equipment on Thursday weighed in with earnings of 19 cents a share in the fiscal
third quarter vs. a four-cent loss a year ago and topping analyst estimates
averaging 17 cents, according to research firm First Call/Thomson Financial.
Ciena also said it expected to beat estimates for 2001.
Finisar
(
FNSR |
Quote |
Chart |
News |
PowerRating), a provider fiber-optic
systems for computer networks, reported after Wednesday’s close that it expects
revenues for its July 31 quarter ended exceed prior-year quarterly revenues by
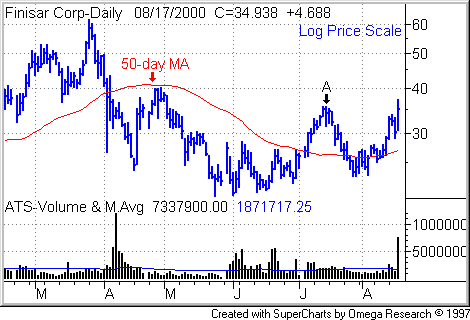
about 95%. On Thursday, the stock rose 4 11/16 to 34 15/16 on four times its
usual trade. The stock came public in November 1999. So it has not traded long
enough to generate a 12-month RS score. Finisar had a six-month RS of 30 as of
Wednesday’s close.

The stock has made progress off its
lows and has cleared its 50-day moving average. However, it backed off
resistance around 35 1/2 a share (see Point A in the above chart). Finisar also
is trading below its mid level of around 41.
The mid level represents the point
where a stock has made up half the maximum point loss of a correction. You can find a stock’s mid level by
summing the pre-correction high and the post-correction low, then dividing the
result by 2. For long trades, I steer clear of stocks trading below their mid levels on the assumption that they are weighed down
by too much overhead supply. Overhead supply
represents shares in
the hands of investors with paper losses. These weak
holders tend sell into rallies, blunting
further share-price progress.
Global Crossing, a builder of undersea
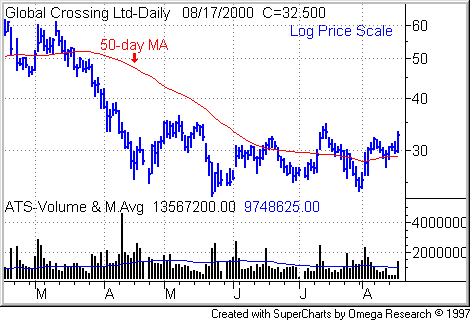
fiber-optic networks, rose 2 11/16 to 32 1/2 on above-average volume after a
Merrill Lynch analyst said he met with the company’s management and expects
execs to raise forecasts for the year.

The stock has some of the same
problems as Finisar. Shares are trading below their mid level, around 43 a
share. Relative strength is a dismal 29.
