Downward Bias Trading Range Testing Support
The
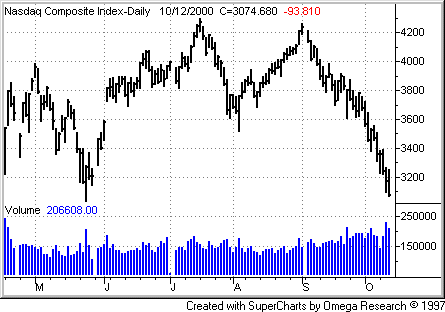
market continues to fall in response to weaker earnings announcements and the
beginning of a disinflation in valuations in the Nasdaq 100 tech stocks, which
have been valued at historically outrageous levels for about six years. The 3000 level must hold for the Naz — a weak close on strong volume
below 3000 will mean serious and lasting trouble for the big-cap techs. The same goes for the 9700 level on the Dow and the 1300 level on the
S&P. Remember, we’ve been saying
for some time now that if the market can get through October without these
levels giving way, then a significant rally is likely to develop in the
strongest season for the market, November-January. However, if all three of these levels give way, we are in a real bear
market, and investors should not expect the type of environment we’ve seen over
the last 18 years to return any time soon, if ever. Needless to say, investors should be watching these final bull market
support levels like a hawk. The
ideal scenario (for the bulls) would be for these to hold and a couple of decent
follow-through days up to develop a week or so after a test of these levels
holds. The ideal scenario for the
bears would be for these levels to quickly give way like a hot knife through
butter. Oversold oscillators mean
nothing in a real bear market — so you must let the market tip its hat on its
next direction. Until either a
retest and some good follow-through up, or a breakdown below all three of these
critical index support levels, the trading range continues, and so should our
cautious stance.
Let’s
look at some numbers from the week. New
Highs vs. New Lows on our RS/EPS lists were
21/20, 14/43, 8/31, 10/26
and 11/65 (notice new lows now expanding during this decline while new
highs fall consistently), respectively, for the latest week, last Thursday through
Wednesday. There were roughly two breakouts on the upside with 10 breakdowns on the downside of four-week-plus consolidations on our RS/EPS lists.
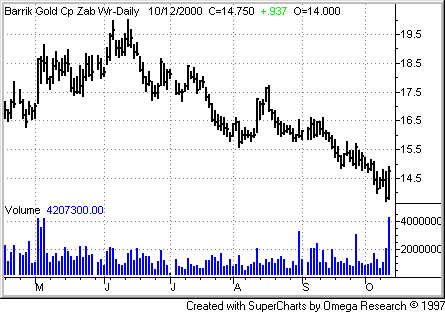
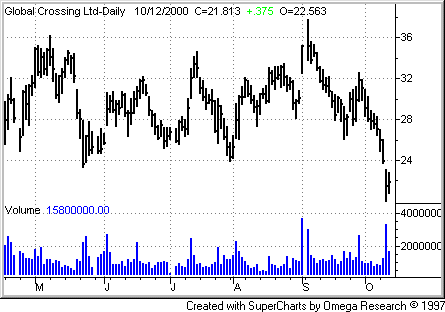
However, there really was a little more activity this week via our strategy —
two breakdowns were both valid and met our downfuel criteria (in Barrick Gold
(
ABX |
Quote |
Chart |
News |
PowerRating)
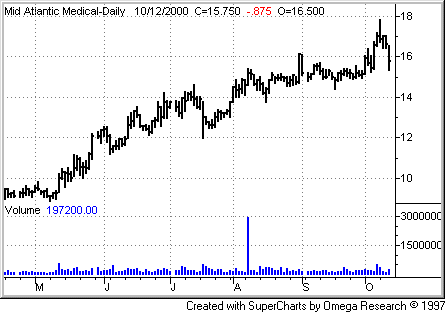
and Global Crossing [GBLX|GBLX), while (believe it or not) there was also a
valid breakout in a stock meeting our upfuel criteria (in Mid-Atlantic Medical
Services
(
MME |
Quote |
Chart |
News |
PowerRating)). There was one trailing stop hit on a short. However, neither long opportunities
nor short opportunities are developing in anything remotely resembling full
gear. Therefore, we will continue to advocate a cautious stance, with investors to add no
more than two trades per side in the next week.
Our
overall allocation remains quite low. We
remain around 15% long (including open profits) and 42% short for aggressive
accounts using leverage (8% long and 21% short for unleveraged, more
conservative accounts). Last week
our longs rose an average of 6.32% (and with 15% allocation, this added 0.95% to
our overall portfolio), while our shorts rose 2.37% on average (and with 42%
allocation, this added 1% to our overall portfolio), giving our overall
portfolio a gain of about 1.95% on the week and leaving us with around a 79.65%
gain on the year (just 0.35% below new-equity highs) on a 12% maximum drawdown so
far. Conservative investors not using leverage show about half these gains and
drawdowns. Our snail-slow gains with
relatively low volatility in our total account continue, but we have managed to
keep our gains and avoid the bloodshed and volatility many other strategies have
shown here, which is actually even more important
than cleaning up from the big moves up. (Offense sells tickets, but defense wins
Super Bowls.)
For
those not familiar with our long/short strategies, we suggest you review my
10-week trading course on TradingMarkets.com, as well as in my book The Hedge
Fund Edge and course “The Science of Trading”.
Basically, we have rigorous criteria for potential long stocks that we
call “up fuel,” as well as rigorous criteria for potential short
stocks that we call “down fuel.” Each day we review the list of new highs on our “Top RS and EPS New
High list” published on TradingMarkets.com for breakouts of four-week-or-longer
flags, or of valid cup-and-handles of more than four weeks.
Buy trades are taken only on valid breakouts of stocks that also meet our
upfuel criteria. Shorts are similarly
taken only in stocks meeting our downfuel criteria that have valid breakdowns of
four-plus-week flags or cup-and-handles on the downside.
We continue to buy new signals and sell short new short signals until our
portfolio is 100% long and 100% short (less aggressive investors could stop at
50% long and 50% short). In early March,
we took half-profits on nearly all positions and lightened up considerably as a
sea change in the new economy/old economy theme appeared to be upon us. We’ve been effectively defensive ever since, and continue to be.
Upside
breakouts meeting fuel criteria (and still open positions) so far this year
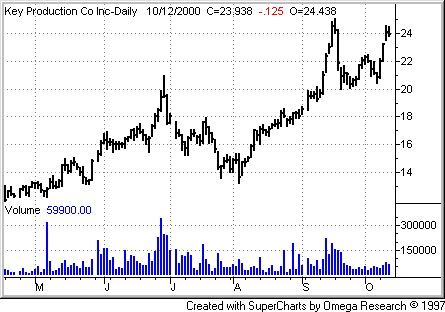
are: Key Production
(
KP |
Quote |
Chart |
News |
PowerRating) @21 w/20.25 ops; and this last week we had
one valid pattern breakout up in
stocks meeting our upfuel criteria (see 10-week trading course): Mid-Atlantic
Medical Services
(
MME |
Quote |
Chart |
News |
PowerRating) @16.56 w/14.25 ops. The average gain in these stocks from
breakout points of entry to Wednesday’s close is 69%, substantially
outperforming the NASDAQ, DOW and S&P for the year to date. Continue to
watch our NH list and buy flags or cup-and-handle breakouts in NH’s meeting our
upfuel criteria — but continue to add just two per week.
On
the downside, this year we’ve had breakdowns from flags (one can use a down
cup-and-handle here as well) in stocks meeting our downfuel criteria (and still
open positions) in: Corus
Group
(
CGA |
Quote |
Chart |
News |
PowerRating) @ 11.88 w/8.25 ops; Blockbuster
(
BBI |
Quote |
Chart |
News |
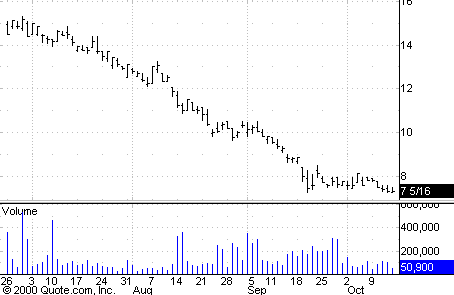
PowerRating) @8.94 w/8.75 ops; Kmart
(
KM |
Quote |
Chart |
News |
PowerRating) @6.38 — stopped out at break-even trailing stop;
Sprint
(
PCS |
Quote |
Chart |
News |
PowerRating) @40.81 w/37.5 ops; and Xerox
(
XRX |
Quote |
Chart |
News |
PowerRating) @11.38 — now use 13.25
ops; and
this last week, we had valid pattern breakdowns in stocks meeting our downfuel
criteria (see 10-week trading course) in Barrick Gold
(
ABX |
Quote |
Chart |
News |
PowerRating) @14.44 w/16 ops;
and Global Crossing
(
GBLX |
Quote |
Chart |
News |
PowerRating) @21.44 w/26 ops. These shorts are down over
63% from breakdown levels on average
so far this year (before current prices or exits). Continue to watch our
NL list daily and to short any stock meeting our downfuel criteria (see 10-week
trading course) breaking down out of a downward flag or down cup-and-handle.
Here, too, remain cautious by only adding two shorts in a week. Especially if
supports hold here, we can expect to be whipsawed on this week’s, or upcoming,
shorts.
Despite
the Nasdaq’s weakness, we need a couple of weeks of abundant breakdowns that meet
our downfuel criteria on the downside in order to release our cautious stance
toward shorts. We would need
support to hold, a couple of good follow-through days, and a couple of weeks of
abundant breakouts that meet our upfuel criteria to release our cautious stance
toward longs. Remember to let
market action be your guide. Only
when our opportunities grow to become abundant will we be able to get more
excited about moving our long allocation or short allocation up to more
aggressive levels. Let’s stick
religiously with our strategy and let it tell us how aggressively or defensively
to allocate and to what vehicles on what side of the market, since the strategy
is doing so well in this market environment. Enjoy the ride – both on defense and offense. Remain defensive and cautious during the week ahead. On a decent week, we’ll be at new equity highs, which is doubly fun when
most others are getting killed.
