Potential Trap Doors Setting Up Here
Friday
opened with a quick downdraft from Thursday’s close of 868.52 for the SPX
(
$SPX.X |
Quote |
Chart |
News |
PowerRating). It retraced
to 861.22 vs. the .786 retracement to Thursday’s 858.09 low of 861.52 and gave
you a 1,2,3 higher bottom setup with entry above 863.06. This level also has 863
as the .618 retracement to the 1994 low, 862, which is the .50 retracement to
935.05, the last major SPX high of Jan. 13, and 861.50, which is the .50
retracement from 769 to 954. The point is you had plenty of awareness levels to
take any defined pattern that came your way, like the 1,2,3 higher bottom.
This trade only ran to
869.88 and failed. Once again, the 870 magnet is in play. 870 was also the 1,2,3
trend short entry on Thursday afternoon on the 3:25 p.m. ET bar. 869.20 was the
.618 retracement to Thursday’s 874.15 high, so another reason why you were alert
to manage your trade carefully and for sure taking at least half of your
position off the total in either the futures or the
(
SPY |
Quote |
Chart |
News |
PowerRating)s. It was trend
down into the close of 863.50 after that 869.88 high on the 11:45 a.m. bar. I
call it a day that traded by the numbers with no significant selling or buying
pressure.
NYSE volume 1.2 billion,
a volume ratio of 45, and breadth +263. In the sectors, gold led, with the XAU
+7.3%, and the bond proxies, the TLTs, also advanced, along with energy, so that
is your basic Iraq move. There was also some green in the healthcare sector and
a few of the basics. Technology was on the weak side, as the Nasdaq
(
$COMPQ |
Quote |
Chart |
News |
PowerRating) declined 1.06%, and the SOX -2.1%. The SPX ended -0.6%, while
the Dow
(
$INDU |
Quote |
Chart |
News |
PowerRating) was essentially flat. It was a narrow-range day for
the SPX at 9.05 points and the fifth day down in the pullback, so that puts us
on alert for any possible upside reflex.
The intraday "820" trend
method is negative in all three periods, the 60-, 15- and five-minute time
frames, but the higher daily time frame is still positive after the five-day
pullback. The 8-day EMA is above the 20-day EMA, which is about 855. There is a
lot of chop in the 870 – 875 zone, with a confluence of several awareness levels
above that, and above that, we have the 880 and 884 levels, which have some
magnet quality.
There are obvious
potential Iraq catalysts that can significantly influence price in either
direction, so no heroes please. Keep it tight and simple. Today’s 1.0 volatility
band is 875 on the upside, right at resistance levels. The downside 1.0
volatility band is 852, which coincides with the five-day 3.0 standard deviation
band. The five-day 2.0 standard deviation band is just above at 856. The +2.0
standard deviation band on the upside is also at 875, so we certainly have an
intraday zone of reference. If you look at a 20-day 30-minute standard deviation
chart, you will see there’s nothing extended, as the SPX has been trading over
the 1.0 standard deviation band for the past 10 days.
We have looked at a quick
framework of the primary major index, which is the SPX. Also, re-read the March
27 commentary for a quick downside levels summary. As I finish this, the S&P
futures are trading at 851, down 12, the Dow at 8020, -100, and the Nasdaq is
-19. So, if the early red holds, we are looking at potential Trap Doors right in
the 1.0 volatility band zone or lower. Also, as the SPX trades below 858.09, you
should be aware of the Fib extensions of the leg up from 858.09 to 874.15. These
levels are the 1.27 at 853.75, the 1.414 at 851.44, 1.618 at 848.16, the 2.0 at
842, which is also the .50 retracement zone to the 789 low, while the 2.24 is
838.17. The .618 retracement to the 789 low is down at the 830 zone. You now
have the framework in advance, so you can concentrate on the price and dynamics
as patterns set up around any one or more of these levels, and they will.
Have a good trading day.


Five-minute chart of
Friday’s SPX with 8-, 20-,
60- and 260-period
EMAs

Five-minute chart of
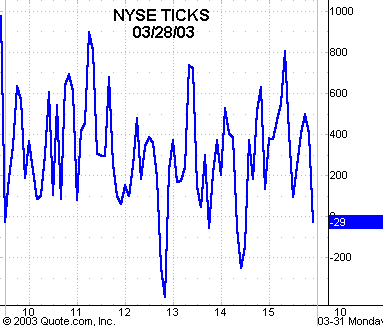
Friday’s NYSE TICKS
