How Far Is Your Stock Going?
So often traders ask
about how high or how low their stocks might go. Of course, nobody can
accurately predict the future, but you should try to find out how far your
stocks may travel before placing orders. By calculating approximate potential
targets before committing yourself to trade, you can eliminate unprofitable
transactions. This is especially true if your stock is trading in a certain
pattern, such as a flag or a triangle. You can then calculate your price target
quite easily.
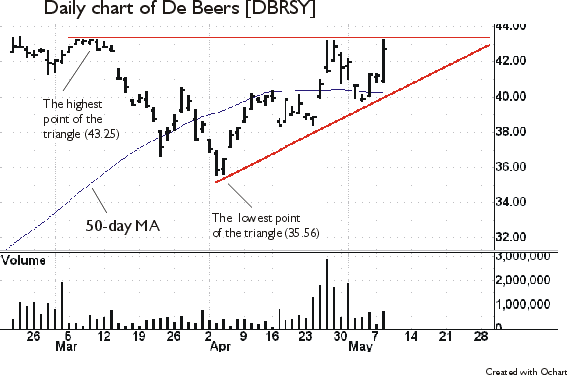
De Beers Consolidated Mines (DBRSY)
closed just below the top of an ascending triangle today, and traders are
looking to buy the stock upon a successful breakout. How high should we set our
profit target? You can calculate the target by following two simple steps.
1. Subtract the lowest point of the triangle (35.56) from the highest point of
the triangle (43.25).
43.25 – 35.56 = 7.69
2. Add the above result to the breaking out point.
7.69 + 43.25 = 50.94
According to the calculation above, De Beers may hit 50.94. Needless to say,
this is only one way of guessing the target.

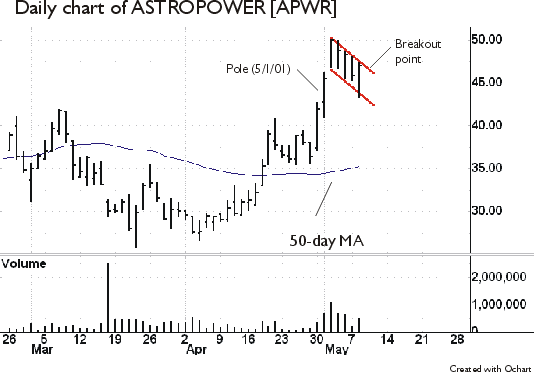
You can apply a similar method to calculate the price target for flag patterns.
A difference here is that you need to add the height of the pole to the breakout
point. ASTROPOWER Inc (APWR)
also finished today just below the top of a flag pattern. The height of the pole
is same as the range of the May 1 bar (46.21 – 41.00 = 5.21). I assume the stock
broke out today, so the breakout point is today’s high of 47.35. After the
calculation, the stock has a potential target price of 52.56.

Till Wednesday,
