The Clock Ticks
With virtually all of the overbought/oversold indicators we follow
continuing to
remain glued to the ceiling in the overbought area, we can’t help but to wonder how long it will last. The question
du jour no longer is, “Is
this the bottom?” but rather, the Street has been whipped into a frenzy with
questions of “Can we make new highs?” At the current rate of advance, the
Dow Jones Industrials would only need five more days like yesterday to reach a new
all-time high. It used to be the Turk would only step in when things were getting downright
scary…now he’s coming to work when there’s a downtick.
Yesterday morning, premarket, Stuart Freeman from A.G. Edwards publicly stated that, “The only risk to the stock market is not being in it.” In
addition, Mr. Freeman projected quarters of +4% GDP next year.Â
Things like this make the hairs on the back of my neck stand up…for a week. The
strategists and analysts who called the “bottom” a month ago certainly have
produced a self-fullfiling prophecy as the troops have summoned back billions of dollars into equity funds in April. How can we tell when
— or if — this will ever end?
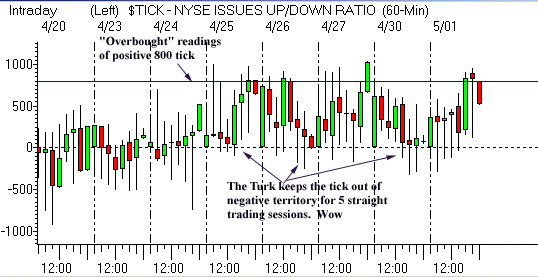
One of the indicators I like to use is an intraday chart of the NYSE tick reading stretched out over multiple trading sessions. The chart below
displays tick readings for the past four sessions. Â

As you can see, the NYSE tick has registered “overbought” readings of
800+ tick readings on 15 separate occasions on the 60-minute chart over the past
five trading sessions. Add to this the fact that the NYSE tick was not allowed
to close below the 0 level at any point in the past five sessions, and you can see
how manipulated this index has been. Occurrences like these are usually
not a phenomenon of normal market dynamics.
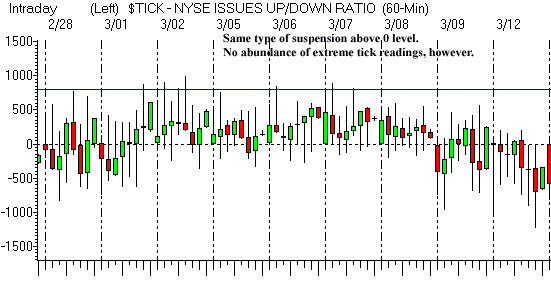
Looking back over the course of this year, I find another juncture when this same type of pattern occurred:Â March
02 to 08.

An examination of this 60-minute NYSE tick chart from early March reveals a similar pattern of holding the tick above the 0 line for an extended period
of time. However, this period does not have the same amount of extreme
tick readings as we have observed the past five sessions.Â

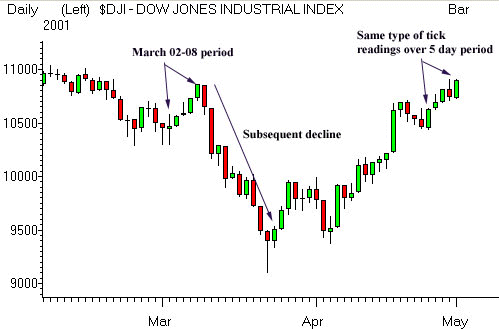
The daily chart of the Dow Jones Industrials indicates the two periods we have analyzed above. As you can see, a precipitous decline followed the March
02-08 period.Â
With the McClellan Oscillator at +150, the 10-day TRIN reading at .90, and the put/call ratio for the past
five days somewhere around .40, could we feel safe going long here? I know, I know, “but the market keeps going
up.” In the long run, staying alive is the name of the game. If you chase and feel
comfortable doing it because you got rewarded a few times, you will keep doing it
— and it will ultimately destroy you.
I must remind my readers that I am a technical trader, not a momentum trader. I don’t believe in buying stocks that were up for the past
three days or shorting stocks that have been down for the past three days. I look for
technically sound trades with minimal risk. The downside to this approach
is I will not participate in “party” type of atmospheres where everyone
and their grandmothers are pumping money back to equities. Playing the long
side produced some good trades a few weeks ago but conditions have become far to
risky for long swing trades at this juncture. I continue to look for a reversal down and a retracement of the current advance.Â
The way things are looking, you would think the indexes will never trade in the red again. I
have spoken to many traders who have thrown up their hands and walked away from the market yesterday, no longer waiting for a reversal signal. Could
this be a sign of capitulation from the shorters? Have the lunatics
taken over the asylum for good now? We will see, and it won’t take long now.Â
It is clear that we either reach up and make new highs in the Dow, or we fail to
advance beyond today’s highs of the first 30 minutes of trading.
Keep your eyes and mind wide open to anything that may happen.
Goran
