Pressure Points
Look for opportunity where an immovable object
meets an irresistible force. In trading terms, that’s the volatile interface between a strong uptrend and a powerful downtrend. Just like the situation that we find ourselves in right now.
The broad markets pulled out of their winter doldrums last month and ignited a substantial rally. Strong upside momentum and bullish enthusiasm showed its face for the first time since last summer. But skilled traders have noticed that this growing excitement is pulling up quickly into major overhead resistance. So everyone is asking: what do we do now?
First, we need to find our playing field. The Philadelphia Semiconductor Index
(
SOX |
Quote |
Chart |
News |
PowerRating) has been the Nasdaq’s canary-in-the-coalmine throughout the bear market. Reading the price action on the SOX (and its major components) has been a great way to anticipate major market turns, impending short squeezes and important breakdowns. My favorite play on the SOX is Altera (ALTR), for both daytrades and swing trades. Its mid-level liquidity, smooth price action and deep ECN representation allows me take advantage of the SOX swings with good precision and low slippage.
Let’s peek at the current trade setups on this broad chip index and one of its major components.

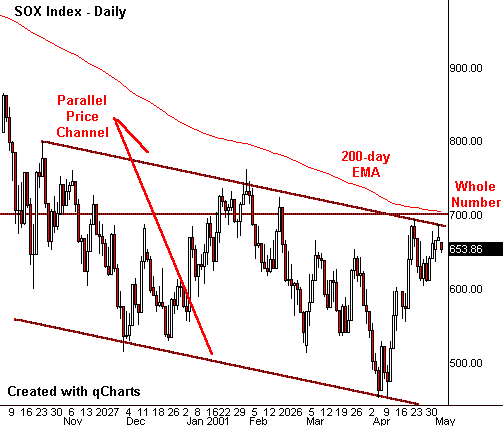
Price has only two choices upon reaching a barrier: continue forward or reverse. Traders take positions in the direction of highest probability, but control their risk if proven wrong. The current SOX barriers are
well-marked and stacked up on one another. See how the current rally has stalled at the top of a declining parallel price channel. But that’s not all. Just overhead is the 200-day EMA, sitting right at the whole number of 700. No surprise that a small double top has formed, while price decides which way to break. The upside trade is simple. Look for a sharp breakaway gap on substantial volume, above the key 700 barrier. If it looks like a no-brainer when it happens, trade hard in the direction of the trend, and don’t hesitate. A breakout from a
seven-month base can be very dynamic.

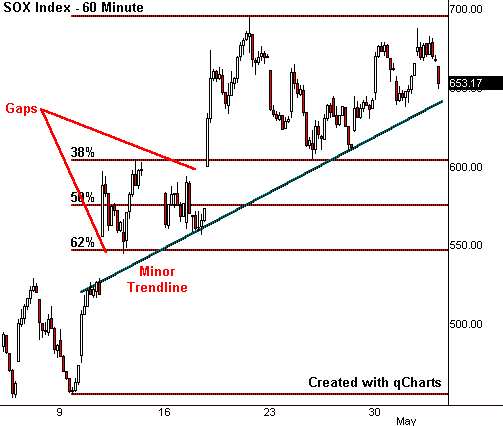
Let’s move in a little closer. A Fibonacci grid and trendline drawn over the recent 60-minute bars offer clues to the short-term price swings. If the SOX breaks that minor trendline, it won’t be the end of the world. But it will represent a sign of weakness that informs short sellers to pay close attention. Notice the
two gaps and congestion bars within the 38% to 62% levels. The gap through 600 suggests that a breakdown below the potential double top will come as a bearish Island Reversal, with a down gap though the same price level as the up gap. Defensive short sales in semiconductors can be entered after that gap. But keep in mind that the 38% to 62% Fibonacci zone often generates substantial whipsaws. Just look what happened when price passed through this zone during the
uptrend.
The key breakdown will come on a violation of the second gap and 62% retracement (under 550). This should lead to a sharp decline, perhaps all the way back to the bottom of the parallel channel. The last 38% of a 100% retracement back to a major low tends to be very dynamic, with great profit potential. But it’s also the place that many traders hesitate, waiting for a reversal that never comes.

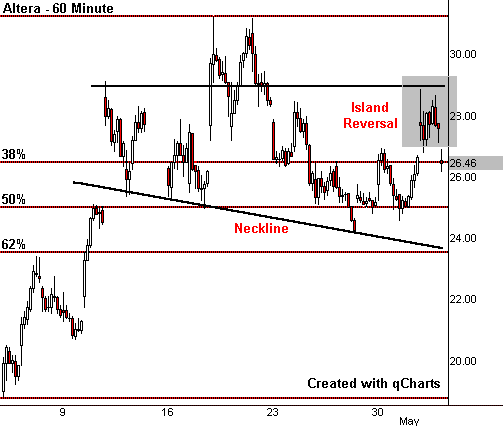
Individual stock plays require more attention to detail. Most of us will use the SOX index as a road map, but our profit will depend on picking the right stock as a proxy for the sector. Altera looks like a good choice on the short side because its price action has been far less bullish than the broader index. While the SOX rallied back to its mid-April high, ALTR could only retrace about 50% of the distance. Its 60-minute chart also has an uglier appearance, with a possible head-and-shoulders top. Look at the declining
“neckline.” The breakdown point would occur right at the 62% retracement. And it could happen on the same bar as a break of the SOX through similar levels.

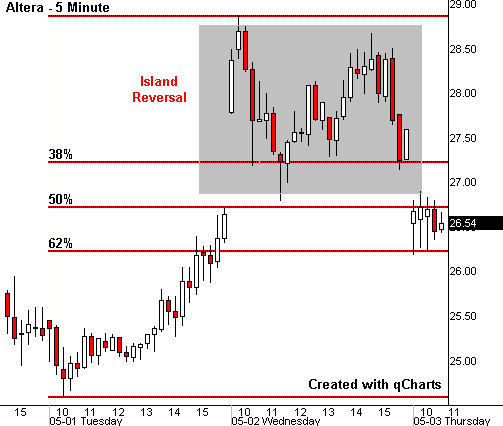
Don’t feel like waiting that long to enter a short sale? This week’s price action set up a similar breakdown scenario at the intraday level. And it shows a great example of the market’s fractal nature. A small double top on Wednesday gapped down the next morning in an Island Reversal. Price dropped to the 62% retracement, where it is congesting as this article is being written. Will it break through? You can bet that the daytraders are watching that price level very
closely and will be selling short if it does.
Want to know a secret? We market technicians have little bags hidden under our trading desks. They hold all of our buzzwords about market direction, especially during important turning points. Whenever we need to write a column, or make a broad prediction, we reach in and grab the one that causes us the least
embarrassment in case we turn out to be wrong.
Recent market action has put these bags to great use. But it’s very hard to turn profits with words. That takes timely
analysis and a strong stomach. It is precisely those times when the markets are the most difficult to interpret that the greatest opportunities appear. Choosing wisely right now between the bullish surge and that great wall of resistance can have a great impact on your bottom line.
