TradingMarkets Chart of the Day
For today’s Chart of the Day, let’s take a look at the
Pullbacks from Lows page in the
Indicators
section. Most successful momentum-based traders and money managers like to
sell weak stocks after they pull back. TradingMarkets.com uses a proprietary
mathematical model to identify up to 20 (in strong or choppy markets there will
be fewer) weak stocks that have pulled back from recent lows. Simply put,
these are trending stocks that are moving against the trend; use your knowledge
of the trend to get a better entry price before the stock continues in the
direction of the trend.
Halliburton
(
HAL |
Quote |
Chart |
News |
PowerRating)
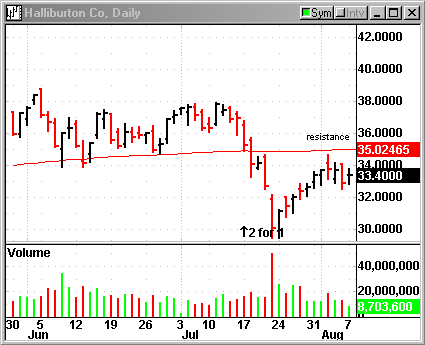
broke down out of consolidation in the middle of July to start a new downtrend.
HAL made 8-month lows on 7/24 before initiating a reversal. As HAL’s price
moves closer to the 200-day
moving average,
watch for the stock to move back into the direction of the trend. The
force of the moving average acts as resistance, and knowing these key levels
allows traders to time reversals and continuations much easier.

Remember: Use the trend to
identify pullback opportunities. When a stock moves against the trend,
often this is a great time to enter the trade at a better price before the stock
resumes trending.
