Windsock versus crystal ball
For several months these articles have included a reminder
that "Technical analysis is a windsock, not a crystal ball." To clarify,
a windsock is used to ascertain the current wind direction and intensity. A
crystal ball is used to predict the future. As a practical matter, if we make
decisions in response to known market conditions, we are operating in a mode
that will allow us to adjust our stance as conditions change. Conversely, if we
position ourselves based upon a prediction about the future, we are stuck with
defending that prediction until it comes true or sticking with it until we lose
enough that we are forced to capitulate.
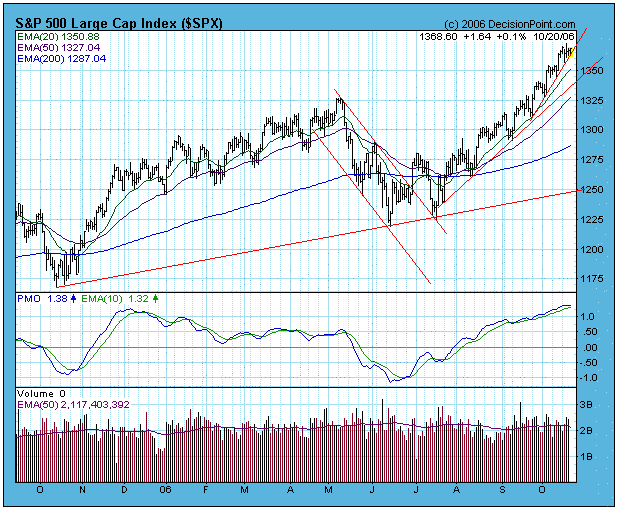
Market action during the period from May 2006 to the present serves as a prime
example of how the crystal ball can get cracked. During the decline from the May
top it was broadly accepted that the bull market top was finally in place and
that a major decline was beginning. The rally out of the summer lows was viewed
as a short-term technical bounce in the context of a longer-term decline. The
bears held fast. As prices approached the level of the May top, hope was born
that a bearish double top was forming. The bears held fast…until the last
three weeks of rally left the bears with little on which to hang their hats.

That is not to say that the bears did not have convincing arguments — I
certainly agreed with most of them — but I have become more of a "windsock"
kind of guy, and find there is less stress when I rely on our mechanical
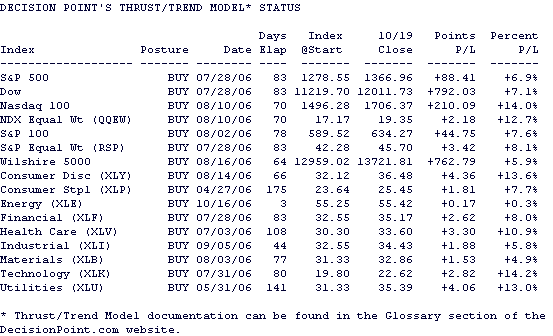
Thrust/Trend Model to help me align with current market conditions. The Model
turned neutral during the decline from the May top, but it turned bullish again
as the market rallied off the July lows. The table below shows how it has
performed with the 16 indexes to which it is applied:

These are decent results, and we should be able to capture some of the profits
if the market turns down at this point, but I don’t want to leave the impression
that there is any sure thing here. The Model has been marginally profitable for
the last few years as market chopped higher in a fairly narrow range. And if the
bears had been right more recently, the Model would have been whipsawed for some
small losses. But that would not have been as distressing as hoping for a
bearish outcome all the way from the July lows to the recent highs.
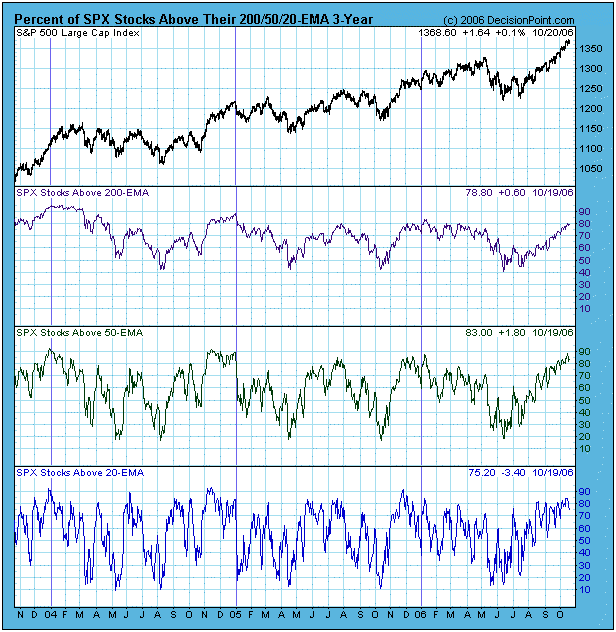
Checking current market conditions, the next chart shows the percentage of
stocks in the S&P 500 Index that are above their 20-, 50-, and 200-EMAs, and it
shows that the market is currently overbought in all three time frames. That
doesn’t mean that there will be a decline — the market was similarly overbought
about a year ago, yet prices continued to rise for several months. Nevertheless,
the market is vulnerable under these conditions and is it not a good time to add
to positions.

Bottom Line: Whether the current up trend continues or ends, we are
fortunate that the Model got us in early. When the market finally turns, we can
be reasonably confident that the Model will take us out and preserve some of the
gains in the process. Keep in mind that Model signals do not predict what is
going to happen, they merely point us in the direction the market seems to be
going at the time.
Technical analysis is a windsock, not a crystal ball. Be prepared to adjust your
tactics if conditions change.
Carl Swenlin is a self-taught technical analyst, who has been
involved in market analysis since 1981. A pioneer in the creation of online
technical resources, he is president and founder of
DecisionPoint.com, a premier
technical analysis website specializing in stock market indicators, charting,
and focused research reports. Mr. Swenlin is a member of the
Market Technicians Association.
