TradingMarkets Chart of the Day
These are stocks that have closed up for five or more
consecutive days and are trading below their 200-day moving average. Our
research shows that stocks trading below their 200-day moving average that close
up for five or more days have shown negative returns, on average, 1-week later.
Historically, these stocks have provided traders with a significant
edge. To learn more about our research into stocks that make five, or more,
consecutive up days, and how to use this information,
click here.
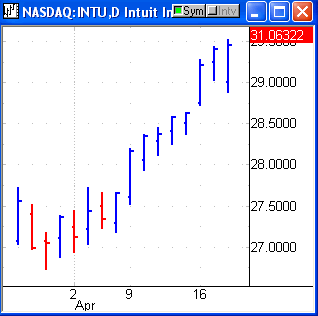
Intuit
(
INTU |
Quote |
Chart |
News |
PowerRating) has been trading below its 200-day moving average since 2/23/07,
showing us that it has been trending downwards.Â
Click here for detailed research on the 200-day moving average by Ashton
Dorkins and Larry Connors. In
Wednesday’s session (4/18/2007), INTU closed higher for the eighth straight session. Watch for price to
potentially move back downwards over the next few days.

Remember: TradingMarkets teaches you to trade pullbacks; use
your knowledge of the trend to get a better buy-in price before the stock
resumes direction.
