3 Important Indicators to Navigate Any Market Environment
There is no one technical indicator that applies equally well to trending and non-trending markets. For this reason, it is difficult to answer the inevitable question from clients: what is your best indicator?
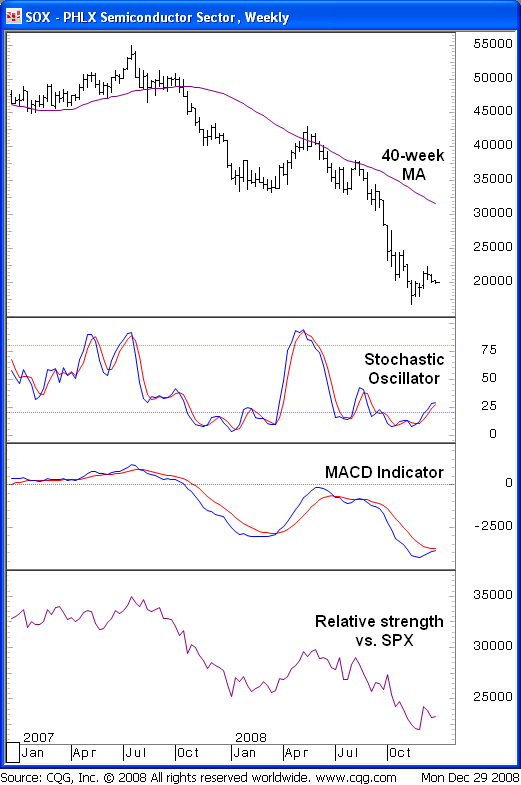
The way I handle the question is by providing a template that includes three technical indicators: the stochastic oscillator, MACD indicator, and a relative strength comparative line, creating what I believe to be the best visual for evaluating a price chart. The combination of these three indicators provides a confidence-building directional bias in trending and non-trending markets, something a single indicator could not achieve as easily.
Click here to order your copy of The VXX Trend Following Strategy today and be one of the very first traders to utilize these unique strategies. This guidebook will make you a better, more powerful trader.
1. The Stochastic Oscillator
The stochastic oscillator is a common technical tool that sends an overbought or oversold message, particularly helpful in a non-trending market. Trading ranges typically have neutral momentum characteristics, so we must turn to an overbought/oversold indicator to aid in identifying low-risk entries and exits. We have found the 12-3-3 stochastics to yield a desirable number of signals, registering an oversold reading (or “buy” signal) when the two lines that comprise the oscillator crossover below 20%, and an overbought reading (or “sell” signal) when they crossover above 80%. The stochastics do not lose validity in a trending environment, but their interpretation becomes more subjective.
2. The MACD Indicator
The MACD indicator sends objective trend-following signals that work best, naturally, in a trending or momentum-driven environment. Using the standard 12-26-9 parameters, a bullish crossover occurs when the signal line crosses above the MACD line in a lagging indication of a turnaround, and vice versa for a bearish crossover. Oftentimes, the stochastics have signaled a turnaround before it is confirmed by the MACD indicator, making them complementary indicators. The best “buy” signals seem to occur when momentum is positive based on the uptrending nature of the MACD indicator, and the stochastics are near oversold levels.
3. Relative Strength Comparative Analysis
Once a directional bias is derived from the stochastics and MACD indicator, relative strength comparative analysis can be used to provide additional confidence. A relative strength comparative line is simply a price-to-price ratio, often applied to a stock relative to a sector or major index (i.e., CELG versus the BTK). The line can be evaluated in the same way as price, using trendlines or simple moving averages. An uptrending relative strength line would add confidence to a bullish bias, suggesting the underlying financial instrument is poised to outperform the index it is being compared to, and vice versa.
Unfortunately, we cannot remove subjectivity from technical analysis, but we have found the three indicators described above provide a strong directional bias that has better results than a single indicator with a strictly objective output.
Katie Stockton is a Chief Market Technician at MKM Partners LLC. Prior to joining MKM, Mrs. Stockton worked as a trader for New York-based hedge fund Ulysses Management and was a publishing analyst for Morgan Stanley’s technical strategy group.
Backtested on over 17,000 trades test this new trading indicator for Leveraged ETFs and find high probability setups daily – click here now.