3 Stocks headed higher, GOOG to $480
Editor’s note: Please join us in welcoming
daytrader Andy Swan to TradingMarkets.
Analysis of Gaps says GOOG Headed to $480 and TASR has Bottomed
A Gap Open
occurs when a stock opens at a significantly different price than it closed at
on the previous trading day—creating a “gap” on the chart. Most stock traders
understand what a gap is, but very few understand what a gap might mean.
There are basically three types of gaps, and knowing which type of gap a stock
is experiencing could be the difference between a very profitable setup and a
losing one.
Gap #1: The Breakaway Gap
(
MEDI |
Quote |
Chart |
News |
PowerRating)
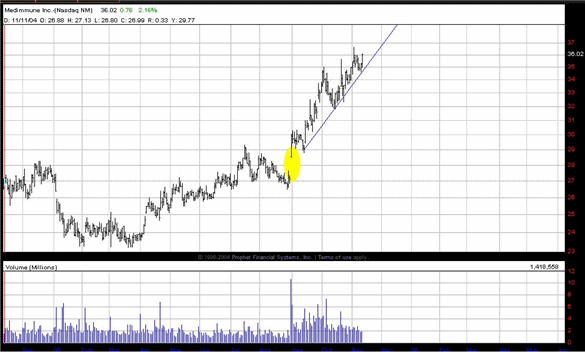
One of the easiest (and most profitable) gaps is called the breakaway gap. This
type of gap usually occurs after the stock has been in a tight consolidation
pattern or trading range:

MEDI produced a breakaway gap at the end of August and has been in a solid
uptrend ever since, consistently bouncing off of the uptrend line to higher
highs. In fact, we just closed a swing trade on MEDI for a gain of over $1.00
per share in a single day simply from watching this stock for low volume dips to
the uptrend support line.
Gap #2: The Measuring Gap
(
GOOG |
Quote |
Chart |
News |
PowerRating)
Following a breakaway gap, the stock will often make a very nice move (up or
down) before “stalling out”.
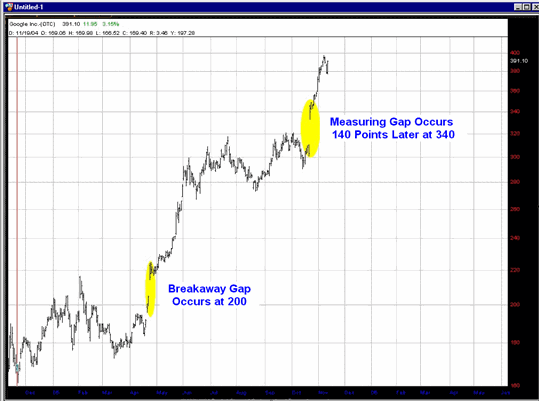
The next gap typically occurs at the halfway point of a major run and is called
the measuring gap. A measuring gap generally occurs right after the stock stalls
in the trend established after the initial breakaway gap. If you look closely,
you can see that GOOG made its initial breakaway gap at 200, and has now made
what looks like a measuring gap (highlighted in yellow) at 340:

If this is indeed a measuring gap for GOOG, it has taken place about 140 points
higher than the initial breakaway gap. In theory, this would mean that GOOG
likely is halfway through a major run and has about 140 more points to go from
the measuring gap at 340. This would mean that GOOG could easily make a run to
480/share!
Over a month (and 100 points ago), we told you why we wouldn’t bet against
Google. Now, we certainly do not expect GOOG to have nothing but an easy ride
higher from here. We think that pullbacks to the top of the measuring gap
(330-340) are certainly possible here, and we will be watching GOOG for buying
opportunities in our Live Trading Room for some time to come.
Gap #3: The Exhaustion Gap
(
TASR |
Quote |
Chart |
News |
PowerRating)
The last two posts have told you about the breakaway gap, which typically starts
a stock’s run and the measuring gap, which typically occurs about halfway
through the stock’s run higher.
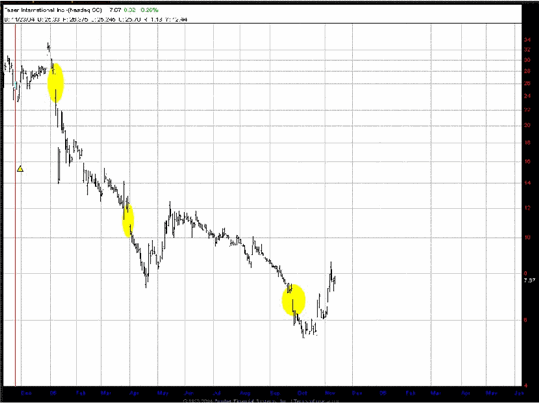
The final gap type is the exhaustion gap–the final gap in the run of a stock.
After a big run, the stock will usually give you one more big overnight move
before breaking the trend and heading in the opposite direction.

You can see the sequence of gaps on TASR as it has run downwards over the last
year. The first highlighted area is the breakaway gap, the second takes place
about halfway down the chart and is the measuring gap, and the third highlighted
area is probably the exhaustion gap.
When a stock moves back through the exhaustion gap, as TASR just has, it is a
confirmation signal that the run is over. Now that the TASR has moved back
through the exhaustion gap, we are constantly looking for low volume dips to buy
into and alert our members on. Thanks to the “the run is over” sign that an
exhaustion gap puts up for us, we can feel confident buying a stock where others
may only see a downtrend!
Andy Swan
created and co-founded DaytradeTeam.com five years ago on a principle of
empowering individual stock and options traders with the techniques and analysis
methods typically reserved for elite professionals. His expertise in technical
analysis and commitment to educating members earned DaytradeTeam a top-ranking
among advisory services for several years.
