Breakout Gallery
So far, so good. Now that we’ve had a
spate of breakouts, keep screening for new buy situations, but also monitor the
breakout leaders.
Keeping an eye on these and their
successors will tell you far more about the market than watching the general
indexes. Remember, if you trade high relative strength stocks for the
intermediate term, you don’t trade the entire market. You just trade the
high-performance segment under very specific technical conditions.
I’ll keep it short today and leave
with a string of recent breakouts.Â
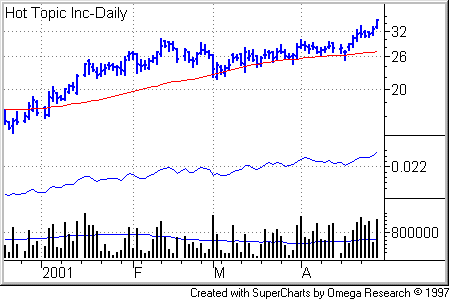
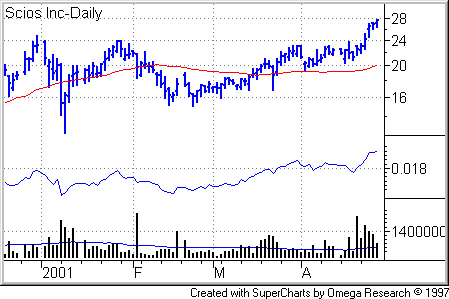
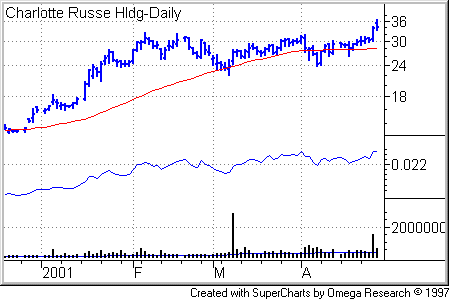
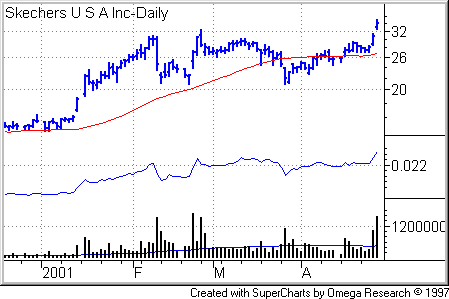
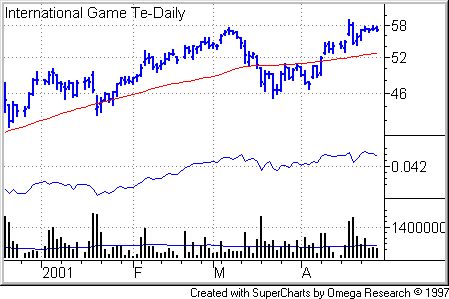
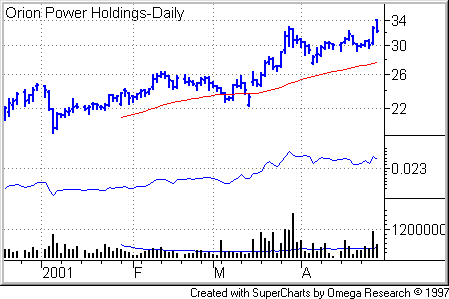
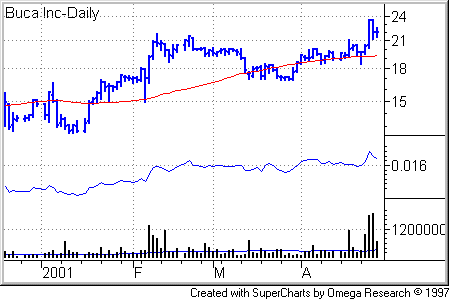
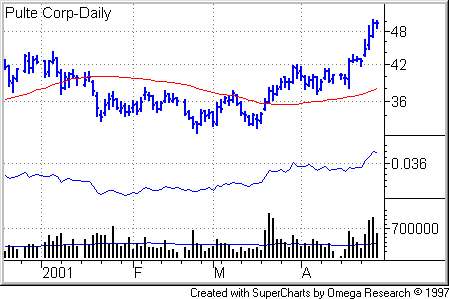
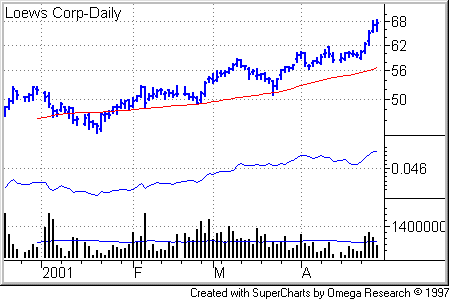
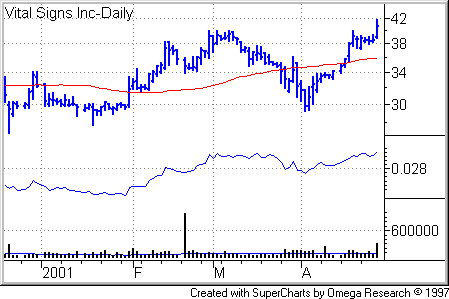
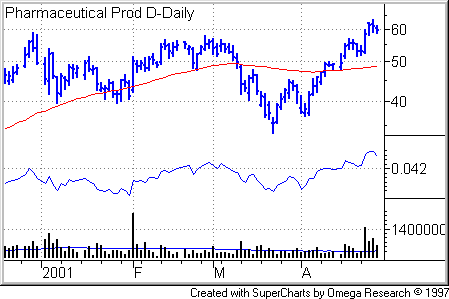
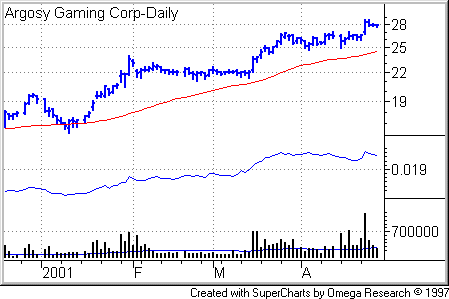
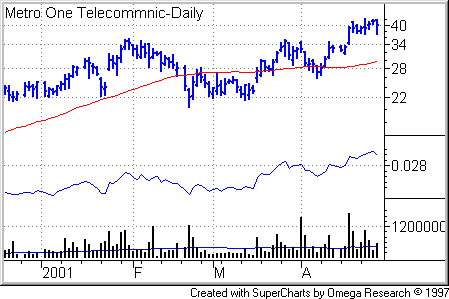
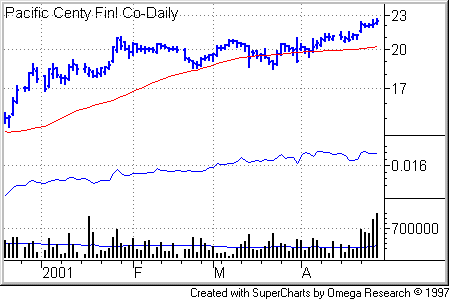
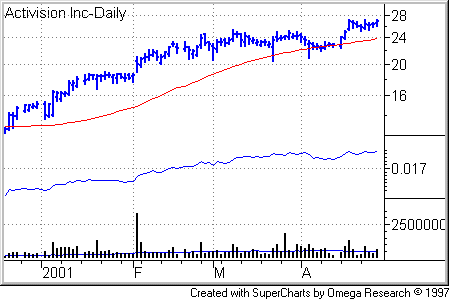
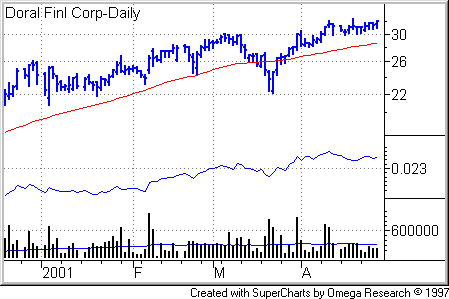
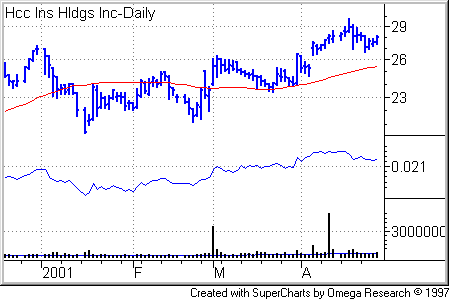
The top field of all stock charts in this
commentary uses a logarithmic price scale and displays a 50-day price average in
red. In the second field, a
blue relative strength line represents the displayed security’s price
performance relative to the S&P 500. The third field displays vertical daily
volume bars in black with a 50-day moving average in blue for volume.
All stocks, of course, are risky. In
any new trade, reduce your risk by limiting your position size and setting a
protective price stop where you will sell your new buy or cover your short in
case the market turns against you. For an introduction to combining price stops
with position sizing, see my lesson,
Risky Business.
